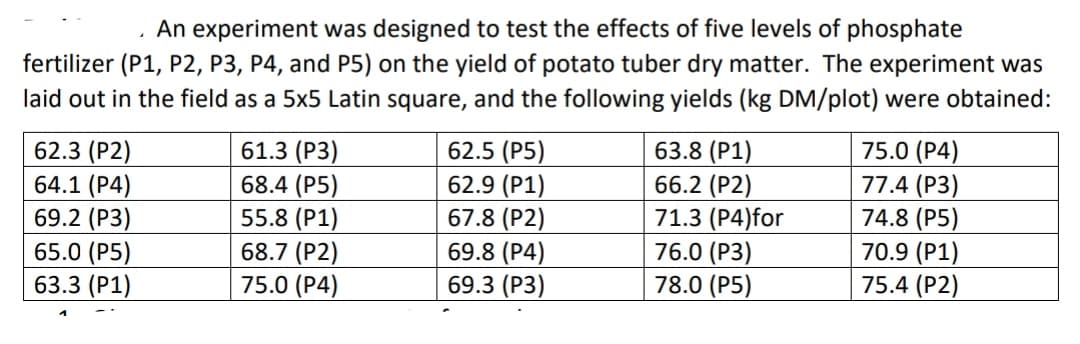
Compute the relative efficiency of this design over CRD and RCBD. Interpret the result


Q: If you were a student, inscribe the things you’ve learned about the different concepts of Testing…
A: We have given the following statement about the Testing of hypothesis. We perform a test of…
Q: 2. Consider the foot length and foot width of six female grade 4 students in Morning Star Montessori…
A: y is a dependent variable and x is an independent variable. The least square regression line is…
Q: The National Longitudinal Study of Adolescent Health interviewed several thousand teens (grades 7 to…
A:
Q: In a survey conducted by a reputable marketing agency, 248 of 1000 adults 19 years of age or older…
A: Here we have to complete the given blanks as per given information
Q: The table summarizes results from 977 pedestrian deaths that were caused by automobile accidents.…
A: Given that Pedestrian Intoxicated Yes=A Pedestrian Intoxicated No=B Total Driver Intoxicated…
Q: The following table summarizes the outcome of a study that researchers carried to determine if…
A: Contingency table is used in parametric chi-square tests.
Q: Determine the t-value in each of the cases. | Click the icon to view the table of areas under the…
A: Since you have posted a question with multiple sub-parts, we will solve first three subparts for…
Q: (1) Two rubber compounds were tested for tensile strength and the fol- lowing values were found A :…
A:
Q: Construct a 99% confidence interval of the population proportion using the given information. x=…
A:
Q: good working condition by satisfaction level. A numerical rating of 5 is assigned to very satisfied…
A: Given information: No. of articles=03 In 1st article, Sample size (x1)=50 In 2nd article, Sample…
Q: 30. What is the Pearson correlation (r) for these data? (SHOW YOUR WORK) 31. How many degrees of…
A: We have given that, SSx = 4 SSy = 25 SP = 6
Q: Suppose that the age of students at George Washington Elementary school is uniformly distributed…
A:
Q: Use this information to answer questions #30 - #35: A set of n = 15 pairs of scores (X and Y values)…
A:
Q: 27. How did you make the determination in Question #26?
A: The given data points are: (1, 6), (3, 2), (4, 4), (5, 5), (7, 7), (8, 3)
Q: mathematics test is applied to 34 students from the UPN people who obtain an average grade of 75.6…
A: Given that Sample size n =34 Sample mean =75.6 Standard deviation =5.23
Q: A software company is interested in improving customer satisfaction rate from the 80% ourrently…
A: Solution Given that , claim proportion of customer satisfaction p=80% That p=0.80 To test the…
Q: Internet tax: The Gallup Poll asked 1043 U.S. adults whether they believed that people should pay…
A:
Q: Pounds 127 120 109 118 143 126 121 128 153 a. Find the correlation coefficient: r = Round to 2…
A: Note: According to Bartleby expert guidelines, we can answer only first question with their three…
Q: 9. Calculate the Pearson Correlation Coefficient (r): (SHOW YOUR WORK)
A: Given that X Y X \cdot YX⋅Y X^2X2 Y^2Y2 2 4 8 4 16 1 3 3 1 9 3 3 9 9 9 6 6 36…
Q: D2)  Time remaining: 00:09:45 Economics IDENTIFICATION: Identify the Term being defined by the…
A: Since we answer up to three subparts, we'll be answering the first three sub-parts. Please resubmit…
Q: 1. How does the cost of shipping a standard-sized crate relate to the distance of the destination?…
A:
Q: Jump to level 1 A home improvement company is interested in improving customer satisfaction rate…
A: Given that Sample size n =287 Favorable cases x =190 Sample proportion p^=x/n =190/287 =0.6620
Q: For the same data set above, if we set our alpha .01, find the critical r from the table:
A: It is given that Number of observations n = 15 SSx = 4, SSy = 25 and SP = 6
Q: Find the critical tt-value for a sample with n=11n=11 and α=0.05α=0.05 for a left-tailed test.…
A: Given that Sample size n =11 Level of significance = ?=0.05
Q: A researcher is interested in finding a 95% confidence interval for the mean number minutes students…
A: Givensample size(n)=119Mean(x)=37.5standard deviation(s)=10.2confidence interval = 95%
Q: Critical values for quick reference during this activity. Confidence level Critical value 0.90 2* -…
A: Given that X=190 , n=1000
Q: A ball is drawn randomly from a jar that contains 3 red balls, 2 white balls, and 7 yellow balls.…
A:
Q: JIUgy.com/2ommon-assessment-delivery/start/5808331814?action3Donresume&submissionld%3D835482324…
A:
Q: Let X represent the full height of a certain species of tree. Assume that we do not know the…
A:
Q: Table #7.3.7 contains pulse rates after running for 1 minute, collected from females who drink…
A: The random variable pulse rate follows normal distribution. We have to test whether the mean pulse…
Q: M2 W3 L3 E1 (Schoology) 1 of 7 O 00:15/20:00 田 17 12 -0.25
A: The following information has been provided: The sample mean is X¯=17 The sample standard deviation…
Q: In each problem show all steps of the hypothesis test using PHANTOMS. If some of the assumptions…
A: Given: Sr. No. Data (x) 1 1.36 2 1.42 3 5.93 4 5.36 5 0.06 6 9.11 7 7.32 8…
Q: Chi-Square Distribution GDC Clothing Inc wants to know whether customers prefer any color over…
A: It is needed to test, whether there is a color preference for the shirts.
Q: One reason normal distributions are important is that they describe how results of an opinion poll…
A: Given that, n = 1050, P=0.40 The Mean and Standard deviation of the sampling distribution of…
Q: Directions: Determine the notation of the given parameter, inequality symbol, or value of the…
A: Given that Average salary of Polytechnic University of the Philippines (PUP) graduate is at most…
Q: An experiment consists of tossing a die and flipping two coins.Let X be a random variable whose…
A: Hello! As you have posted more than 3 sub parts, we are answering the first 3 sub-parts. In case…
Q: A political candidate has asked you to conduct a poll to determine what percentage of people support…
A:
Q: Population Positive Covid 19 No Name density/Km2 Day 1 Day 2 Day 3 Day 4 Day 5 Day 6 Day 7 Day 8 Day…
A: First we enter the given data set in Excel file. Add all the day's values and create a new column…
Q: to = (Round to two decimal places as needed.)
A: Given that Sample size n =200 Sample mean =25.5 Standard deviation =3.9
Q: A golf association requires that golf balls have a diameter that is 1.68 inches. To determine if…
A: Given Mean=1.68 n=12
Q: A rent-to-own (RTO) agreement appeals to low-income and financially distressed consumers. It allows…
A: For validating if there is a discrepancy between the observed frequencies of attributes of RTO…
Q: A random sample of 150 people shows an average salary of 371 pesos per day. With a population…
A:
Q: Hypothesis testing using t: Two-sample We test whether “cramming” for an exam is harmful to grades.…
A: Given data we test whether cramming for an exam is harmful to grades.
Q: Construct a 99% confidence interval of the population proportion using the given information. x=…
A:
Q: x 1 3 4 5 8 y 1 1 9 1 16 1 25 1 64 Model the following data with a power formula. You…
A: Introduction: It is required to model the given data with a power formula.
Q: A sur Columbus residents found that 15 of them were unemployed. What is the margin of error for a…
A: Given
Q: 2. What is common, recurring, or involved in all three problems?
A: A percentile is a statistical measure used to express the percentage of observations falling below…
Q: Concerns about climate change and co2 reduction have initiated the commercial production of blends…
A: Given data n=46 mean=0.9400 standard deviation=0.0030
Q: During the first 15 weeks of the 2016 season of a certain professional football league, the home…
A:
Q: Consider the time series data for the real consumption of households and government from year 1950…
A: AIC represents the Akaike's information criterion. The lowest value of AIC represents the best…
Compute the relative efficiency of this design over CRD and RCBD. Interpret the result


Trending now
This is a popular solution!

Step by step
Solved in 3 steps with 1 images

- Compare the two separate scatterplots. In particular, how do the associtation compare between women with pets vs. women without pets? Does one group have more variation in systolic blood pressure than the other? If so, for which group? Does systolic blood pressure seem higher for common ages between the two groups? If so, for which group?the soil biogeochemistry in Californian salt marshes wished to explore how two of the most common plant species, pickleweed and pacific cordgrass, affected the accumulation of nitrogen in the soil. They measured the concentration of ammonium, a molecular form of organic nitrogen, in the soil, and measured or manipulated the density of pickleweed and cordgrass. Manipulations of ½ meter square plots (20 plots per manipulation) included removing all cordgrass (cordgrass removal), removing all pickleweed (pickleweed removal), or mixed (the control - nothing removed, thus mixed plots included a mixture of natural pickleweed and cordgrass). Boxplots of ammonium concentrations in each of the three manipulation treatments. Letters indicate differences among means as determined by a Tukey posthoc test following ANOVA. (b) Overall relationship between cordgrass stem density and soil ammonium content (includes data from all plot treatments). The solid black line and the gray shading represent the…In an agricultural experiment, the effects of two fertilizers on the production of limes were measured. Twenty-three randomly selected plots of land were treated with a brand new fertilizer, and 21 randomly selected plots were treated with an old fertlizer. The number of pounds of harvested limes were measured from each plot. The results are given below. (Round answers to two decimal places.)Data: New Fertilizer Old Fertilizer 412 480 434 472 436 485 418 453 412 470 415 464 412 482 438 466 439 481 443 470 427 472 426 466 439 493 427 471 438 495 430 479 411 467 424 476 419 493 424 485 425 482 437 420 Find a 90% confidence interval for the difference between the mean weight of the harvested limes.margin of error: lower limit: upper limit: Based on the results, is the new fertilizer better than the old fertilizer? Yes, we are 90% confident that new fertilizer is better than old fertilizer. It's not clear if the new fertilizer is…
- In an agricultural experiment, the effects of two fertilizers on the production of limes were measured. Fourteen randomly selected plots of land were treated with a brand new fertilizer, and 18 randomly selected plots were treated with an old fertlizer. The number of pounds of harvested limes were measured from each plot. The results are given below. (Round answers to two decimal places.) New F. Old F. 498 429 485 428 469 427 481 421 472 412 475 419 488 431 468 436 460 415 469 428 475 417 471 437 476 437 470 420 416 426 427 419 Find a 99% confidence interval for the difference between the mean weight of the harvested limes.margin of error: lower limit: upper limit:The average weight of a Coastal male Grizzly Bear is approximately normal with E(x); =795 pounds and SD * (x) = 80 pounds. 8. How likely is it to randomly select 64 Coastal male Grizzly Bears with a sample average weight of 810 pounds or more? Which density curve is the best model for this problem?In an agricultural experiment, the effects of two fertilizers on the production of limes were measured. Nineteen randomly selected plots of land were treated with a brand new fertilizer, and 27 randomly selected plots were treated with an old fertlizer. The number of pounds of harvested limes were measured from each plot. The results are given below. (Round answers to two decimal places.) New Fertilizer Old Fertilizer 486 435 468 423 491 425 470 440 458 423 476 409 456 425 463 443 493 402 501 437 483 420 475 420 456 416 470 435 463 421 473 445 479 422 460 424 467 412 435 427 413 407 420 430 426 430 Find a 90% confidence interval for the difference between the mean weight of the harvested limes.margin of error: lower limit: upper limit: Based on the results, is the new fertilizer better than the old fertilizer? A) Yes, we are 90% confident that new fertilizer is better than old fertilizer. B) No, we are 90%…
- For a research study with 2 levels of factor A, 4 levels of factor B, and n = 8 in each treatment condition, what are the df values for the F-ratio evaluating the main effect for factor A?a. Compute the incidence rate of coronary artery disease in patients receiving the new cholesterol medication. b. Compute the incidence rate of coronary artery disease in patients receiving a placebo. attached is the image of the data for this problemIn forestry, the diameter of a tree at breast height is used to model the height of the tree. Silviculturists working in British Columbia’s boreal forest conducted a series of spacing trials to predict the heights of several species of trees. The data are the breast height diameters (in centimeters) and heights (in meters) for a sample of 18 white spruce trees. B1 B2 18.9 20.0 15.5 16.8 19.4 20.2 20.0 20.0 29.8 20.2 19.8 18.0 20.3 17.8 20.0 19.2 22.0 22.3 16.6 18.8 15.5 16.9 13.7 16.3 27.5 21.4 20.3 19.2 22.9 19.8 14.1 18.5 10.1 12.1 5.8 8.0 B1: Breast Height Diameter of White spruce (cm) B2: Height (m) a) Plot the relationship using scatter diagram between the breast height diameters and the trees’ height. Are the breast height diameters and the trees’ height linearly related? What can you infer about the relationship between the two variables? Is a linear model appropriate? b) Compare the scatter plot in (a) with the correlation coefficient…
- In a test of braking performance, a tire manufacturer measured the stopping distance for one of its tire models. On a test track, a car made repeated stops from 100 kilometres per hour. The test was run on both dry and wet pavement, with the accompanying results.The performance of two analysts in determining total mercury (mg / kg) in fish was evaluated using the absorption spectrometry method. The results on the concentrations of mercury found in fish, for each analyst, are presented in the table below: Analyst 1 Analyst 2 7 12 9 8 6 9 11 13 13 14 8 9 7 8 13 10 12 7 9 15 (a)Is the performance in determining total mercury for Analyst 1 more accurate than Analyst 2? Compare the accuracy in the results of the two analysts at a 95% confidence level. Explain. (b)Are the results obtained by the two analysts, in the concentrations of mercury found in the fish, statistically equivalent, with 95% confidence? ExplainIf a newborn lab rat receives a hormone and its weight (in ounces) is converted into a z score that is greater than +2.00, what would the researcher most likely conclude about whether or not the hormone had an effect on the rat's weight?
