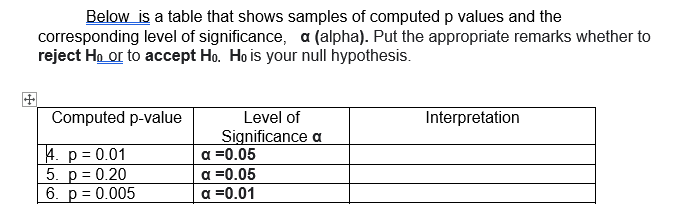
Computed p-value 4. p = 0.01 5. p = 0.20 6. p = 0.005 Level of Significance a a =0.05 a =0.05 a =0.01 Interpretation


Q: The data show the chest size and weight of several bears. Find the regression equation, letting…
A: Excel procedure to compute least-squares regression line: Enter the data of Chest size (x) and…
Q: 2. A recent report on elementary schools in Kent county claimed that 13% of elementary students…
A: Given Information: Claim: 13% of elementary students typically walk to school. Sample size n=80 Out…
Q: b) Pick the correct symbol: ? = 17 c) Pick the correct symbol: ? = 0.8 d) What is the probability…
A: Since you have posted a question with multiple sub-parts, we will solve first three sub- parts for…
Q: The standard deviation of a sample is directly proportional to the square root of its sample size.…
A: We have given the following statement about the standard deviation.
Q: The amount of pollution produced by cars was measured for cars using gasoline containing different…
A: Explanation : Independent variable is nothing but if one variable that has not changed with the…
Q: Two different simple random samples are drawn from two different populations. The first sample…
A: Since, we only solve up to three sub parts of a problem, we'll be solving the first three sub parts…
Q: The manager of a restaurant in a commercial building has determined that the proportion of customers…
A: Given data n=100 p=14%=0.14
Q: 2) An Izod impact test was performed on 19 specimens of PVC pipe, the standard deviation was 0.25.…
A: Given that Sample size n =19 Sample standard deviation =0.25 Population standard deviation =0.10…
Q: Why is it that the "COVID curve" cannot be considered as a normal distribution?
A: Solution-: Why is it that the "COVID curve" cannot be considered as a normal distribution?
Q: Draw the normal curve. Given a normal distribution with population mean is 21 and population…
A: Solution-: Given: μ=21,σ2=64 ∴σ=8 We find x such that, P[X>x]=0.51
Q: A teacher divides his class into groups, randomly selects 3, and asks all students from the chosen…
A: Given that, a teacher divides his class into groups, randomly selects 3, and asks all students from…
Q: According to the model, If the placement test score is 79, the course grade will be
A: The regression model to predict the course grade using placement test score is y=32.51+0.47x.
Q: Consider the following constant function: f(x) = 3/4 If this function represents a probability…
A:
Q: A distribution and the observed frequencies of the values of a variable from a simple random sample…
A: Given that: Distribution (p) Observed Frequency 0.125 19 0.1875 22 0.25 24 0.4375 31…
Q: Find the area under the standard normal distribution curve to the right of z=1.59 . Use The Standard…
A: Given X follows standard normal distribution X ~ N(0,1) Z = 1.59
Q: II. Using the z-table, find the critical value/s for each. 1. a = 0.01, two-tailed test 2. a = 0.10,…
A:
Q: True or false
A: This is the question only for telling whether the condition is true or false, so there is no need of…
Q: A distribution and the observed frequencies of the values of a variable from a simple random sample…
A: Hypotheses: H0: The distribution of the variable is the same as the given distribution. Ha: The…
Q: In the population of drivers, the mean number of traffic violations in the last 10 years is 5.2. In…
A: It is given that Population mean = 5.2 Sample mean = 4.25
Q: JBC Company wishes to test four different gadgets A, B, C, and D. The lifetimes of the gadgets in…
A: The following information has been given: A B C D 33 32 31 27 38…
Q: For a standard normal distribution, find: P(Z < 2.11)
A: The standard normal variable is z, which follows the normal distribution with the mean of 0 and…
Q: The region formed by a probability density function represented by a nonconstant linear function is…
A: "Since you have asked multiple questions, we will solve the first question for you. If you want any…
Q: An advert=isement cla=m that th=eir laptop co=mp=uter batteries are set at 72 operating hours, with…
A:
Q: A physician wishes to know whether there is a relationship between a father's weight, in pounds, (X)…
A: Let X be the Father weight Y be the Son's weight X:176,160,187,210,196,142,205,215…
Q: Suppose that it is known that 45% of eighteen-year-olds in a particular city do not have a driver's…
A:
Q: each of the following. Enter your answers rounded to at least two decimal places. for the za/2 90%…
A:
Q: According to a certain government agency for a large country, the proportion of fatal traffic…
A:
Q: Standard Residuals 1.979463878 0.76560249 1.510106436 1.496613187 -0.121345141 -0.422635952…
A: Standardized residuals have significant role in regression analysis.
Q: Let x be a random variable that represents the batting average of a professional baseball player.…
A: Let X be the independent variable and Y be the dependent variable. Let X represents the batting…
Q: The following are distances travelled (in km) by 35 jeep drivers on a given day: 91 72 81 76 73 73…
A: The provided data are in ascending order…
Q: (a) Suppose the ASX200 Index is currently at 7,406, the expected dividend yield on the index is 2…
A:
Q: The following time series shows the sales of a particular product over the past 6 months. Time…
A: Please note that I have answered as per our guidelines. Please repost the remaining questions…
Q: What is the minimum required sample size to estimate an unknown population mean with confidence…
A: Given: Confidence level=99% Margin of error, E=5.25 Population sd, σ=35.2
Q: 08:00 AM INJVC > Module 2 Assessments > Chapt If an orange tree sapling is planted, it has a 80%…
A:
Q: Before Pregnant Woman After Treatment Difference Sign Treatment 1 8 3 2 10 7 3 6 5 4 8 10 5 11 10 6…
A: Given data: Pregnant woman Before treatment After treatment 1 8 3 2 10 7 3 6 5 4 8 10 5…
Q: 1. Consider the following table. xi 4.0 4.2 4.5 4.7 5.1 5.5 5.9 6.3 256.73 Y₁ 102.56 113.18 130.1178…
A:
Q: please create a summary of findings based on the graphical presentation
A: Given information: Teens who have seen their parents use a phone while driving is 48%. Drivers who…
Q: The following time series shows the sales of a particular product over the past 6 months. Time…
A: Note : As per the guidelines we are supposed to solve only first three sub parts. Please repost the…
Q: PLEASE PROVIDE THE CORRECT AND SOLUTION. (kindly provide complete and full solution. i won't like…
A: Note: As per guidelines we are supposed to solve only first three sub parts. Please repost the other…
Q: A recent survey found that 61% of all adults over the age of fifty wear glasses for driving. In a…
A: Given that Given distribution is binomial. n=Random sample of 80 adult n=80 p=61% of adults over the…
Q: An experiment is conducted to estimate the difference in work productivity for employees under two…
A: The provided information is Twenty employees volunteered to be part of the study. Ten of the…
Q: Find the range and mean or average deviation of the following data. Show your solution. 1.) 8,3,9,4
A: Given 8,3,9,4
Q: 1. What is the correlation coefficient for the bivariate data? [Select] ✪ 2. What is the strength of…
A: Use the Excel and Calculate the Correlation Followings are the Steps to Calculate Correlation 1)…
Q: 1. In an attempt to assess the effect of the length of time spent in using social media to the…
A: a)
Q: Which are considered to be measures of dispersion, or "measures of spread?" median mean standard…
A: Measure of dispersion are those measure the scatteredness inside tye data.
Q: Draw the normal curve. The length of time consumed in waiting for Angkas driver is normally…
A:
Q: You measure 20 dogs weights and find they have a mean weight of 48 pounds. Assume the population…
A:
Q: Let x be season. A random sample of n-6 professional basketball players gave the following…
A: Hi! Thank you for the question, as per the honor code, we are allowed to answer three sub-parts at a…
Q: Would the following situation best be represented using a combination or a permutation? Two socks…
A: Combination used when order of object does not matter and permutation used when order of selection…
Q: d) What is the probability that a student spends at least 15 hours studying? What is the probability…
A: Here, µ= 17 , σ= 5. Here, X follows a normal distribution.

Step by step
Solved in 3 steps

- The average expenditure per student (based on average daily attendance) for a certain school year was $10,337 with a population standard deviation of $1560. A survey for the next school year of 150 randomly selected students resulted in a sample mean of $10, 798. Find the Z statistics? Should the null hypothesis be rejected at alpha = .05 level of significance?The average expenditure per student (based on average daily attendance) for a certain school year was $10,337 with a population standard deviation of $1560. A survey for the next school year of 150 randomly selected students resulted in a sample mean of $10, 798. Find the P-value? Should the null hypothesis be rejected at alpha = .05 level of significance?A trucking firm is considering the installation of a new, low-restriction engine air filter for its long-haul trucks, but doesn’t want to make the switch unless the new filter can be shown to improve the fuel economy of these vehicles. A test is set up in which each of 10 trucks makes the same run twice once with the old filtration system and once with the new version. Given the sample results shown below, use the 0.05 level of significance in determining whether the new filtration system could be superior. Truck Number Current Filter (mpg) New Filter (mpg) 1 7.6 7.3 2 4.1 7.2 3 10.4 6.8 4 6.9 10.6 5 5.6 8.8 6 7.9 8.7 7 5.4 5.7 8 5.7 8.7 9 5.5 8.9 10 5.3 7.1 Do reject or fail to reject H0?
- Listed below are the heights (in inches) of fathers and their first sons. The dataare from a journal kept by Francis Galton. Use a 0.05 significance level to testthe claim that there is no difference in heights between fathers and their firstsons. (State the null and alternate hypothesis, the p-value method to make adecision, and write a conclusion based on the results.) Height of Father 72.0 66.0 69.0 70.0 70.0 70.0 70.0 75.0 68.265.0Height of Son 73.0 68.0 68.0 71.0 70.0 70.0 71.0 71.0 70.063.0For a special pre-New Year's Eve show, a radio station personality has invited a small panel of prominent local citizens to help demonstrate to listeners the adverse effect of alcohol on reaction time, thus drinking an alcohol increases reaction time. The reaction times (in seconds) before and after consuming four drinks are in Sheet 11. Test a hypothesis to see if the showman claim is supported by the given data (use alpha=0.01 significance level). Sheet 11 Subject Before After 1 0,32 0,39 2 0,39 0,44 3 0,36 0,49 4 0,41 0,53 5 0,37 0,46 6 0,35 0,39 7 0,37 0,49 8 0,37 0,52 9 0,32 0,43 10 0,39 0,45 11 0,39 0,39 12 0,41 0,49 13 0,32 0,48 14 0,38 0,48 15 0,34 0,4 16 0,35 0,52 Select one: a. The alternative hypothesis that the reaction time before consuming alcohol is less than after is not accepted as the p-value= 0.0000 is less than alpha=0.005 b. The Null hypothesis that the reaction time before consuming alcohol is less than after is rejected…The NAEP considers that a national average of 283 is an acceptable performance. Using α = .05, run a two-tail t-test for one sample to test Ho: µ=283 for the 2019 scores. Report the t-obt, df, and p-values. Would you reject the null hypothesis that the 2019 scores come from a population with average 283? If this is the case, does it come from a population from larger or smaller average?
- This chart shows the results of two random samples that measured the average number of minutes per charge for AA Lithium-ion (Li-ion) rechargeable batteries versus Nickel-Metal Hydride (NiMH) rechargeable batteries. Down below shows the hypothesis test using significance level (α) = 0.05 to determine if the true average number of minutes per charge for NiMH batteries is smaller than that for Li-ion batteries. 1. From the data given from the first graph below, what would be the correct p value? (the one tail or the two tail?) t-Test: Two-Sample Assuming Unequal Variances NiMH Li-ion Mean 89.35714 95 Variance 3.93956 59.75 Observations 14 17 Hypothesized Mean Difference 0 df 19 t Stat -2.89621 P(T<=t) one-tail 0.004628 t Critical one-tail 1.729133 P(T<=t) two-tail 0.009255 t Critical two-tail 2.093024 For the bottom graph: 1.. Find the point estimate (you can do this by subtracting Group 2…Five samples of a ferrous-type substance were used to determine if there is a difference between a laboratory chemical analysis and an X-ray fluorescence analysis of the iron content. Each sample was split into two subsamples and the two types of analysis were applied, with the accompanying results. Assuming that the populations are normal, test at the 0.05 level of significance whether the two methods of analysis give, on the average, the same result. Determine the test statistic t=?A sample of 20 third-grade students had a average of 54 on a math proficiency test, with a sample standard deviation of 11. Is there enough evidence to conclude that the third-grade sample mean differs significantly from the third-grade population mean of 67? Assume a 0.02 significance level. Use the Critical Value Method of Testing (this means NO P-Values!). will need to have -1. The null hypothesis, Ho 2. The alternative hypothesis, H1 3. The test statistic4. The type of test(left, right, two-tailed) and the p-value 5. The decision to accept Ho or reject Ho
- The Firearm Injury Surveillance Study (FISS) records whether the shooting arose out of a fight and the type of firearm used to cause the injury (here, handguns vs. rifles and shotguns). With an alpha of .01, conduct a five-step hypothesis test to determine if the variables are independent. Please fill out the chart provided and provide calculations. Fight Involved Handgun Long Gun Row Marginal Yes 158A 11B 169 No 309C 133D 442 Column Marginal 467 144 N = 611 Expected Frequency Count fe Calculations χ2obt Calculations:Listed in the data table are amounts of strontium-90 (in millibecquerels, or mBq, per gram of calcium) in a simple random sample of baby teeth obtained from residents in two cities. Assume that the two samples are independent simple random samples selected from normally distributed populations. Do not assume that the population standard deviations are equal. Use a 0.100.10 significance level to test the claim that the mean amount of strontium-90 from city #1 residents is greater than the mean amount from city #2 residents.Two samples of sizes 25 and 20 are independently drawn from two normal populations, where the unknown population variances are assumed to be equal. The number of degrees of freedom of the equal-variances t-test statistic is ?


