Conduct the hopothee t and provide the let atatistic and the ortiol valu, nd stte the conclusion Acompany clime at is packgof 100 candie re distributed with he following color peroentnges 13% red, 22% ornge, 14% yellow, 9% brown, 25% blun, and 17% green. Use the given sample dala to tent the caim that the color distribution olaimed. Use a 0.025 ignfficance level EE Clok he lcon to view the color counte for the candy in the package. Click here to view the chi-eauere dietribution teble Chl-square distribution table Candy package counts
Conduct the hopothee t and provide the let atatistic and the ortiol valu, nd stte the conclusion Acompany clime at is packgof 100 candie re distributed with he following color peroentnges 13% red, 22% ornge, 14% yellow, 9% brown, 25% blun, and 17% green. Use the given sample dala to tent the caim that the color distribution olaimed. Use a 0.025 ignfficance level EE Clok he lcon to view the color counte for the candy in the package. Click here to view the chi-eauere dietribution teble Chl-square distribution table Candy package counts

College Algebra (MindTap Course List)
12th Edition
ISBN:9781305652231
Author:R. David Gustafson, Jeff Hughes
Publisher:R. David Gustafson, Jeff Hughes
Chapter8: Sequences, Series, And Probability
Section8.7: Probability
Problem 5E: List the sample space of each experiment. Rolling one die and tossing one coin

Related questions
Question
Pls help I need in 1 hour
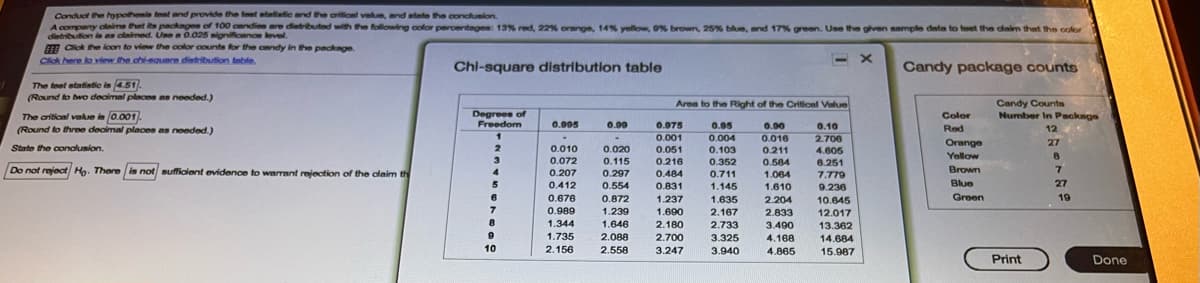
Transcribed Image Text:Conduct the hypolthonis teat and provide the teet statistic and the aritilonl value, and atate the conclusion.
Acompany claims hat its packnge of 100 candies are distributed with the following color percentages: 13% red, 22% orange, 14% yellow, 9% brown, 25% blue, and 17% green. Use the given sample data to test the denim that the color
distribution is as claimed. Use a 0.025 mignificance level.
FE Click he lcon to view the color counts for the candy in the package.
Click here to view the chi-equare dietribution tmble.
Chl-square distribution table
Candy package counts
The test statistio in 4.51.
(Round to hwo decimal places as needed.)
Area to the Right of the Critical Value
The ariticnl value is 0.001).
(Round to three deoimal places as noeded.)
Degrees of
Freedom
Candy Counts
Number In Package
Color
0.995
0.99
0.975
0.05
0.90
0.016
0.10
Red
12
0.001
0.004
2.706
Orange
27
State the conalusion.
2
0.010
0.020
0.051
0.103
0.211
4.605
Yollow
3
0.072
0.352
0.711
0.115
0.216
0.584
6.251
Do not reject Ho. There is not sufficient evidence to warrant rejection of the dlaim th
Brown
0.207
7
4
0.297
0.484
1.064
7.779
9.230
0.412
0.554
0.831
1.145
1.610
Blue
27
0.676
0.872
1.237
1.635
2.204
10.645
Green
19
0.989
1.239
1.690
2.180
2.167
2.833
3.490
12.017
1.344
1.646
2.733
13.362
1.735
2.088
2.700
3.325
4.168
14.684
10
2.156
2.558
3.247
3.940
4.865
15.987
Print
Done
Expert Solution
This question has been solved!
Explore an expertly crafted, step-by-step solution for a thorough understanding of key concepts.

Step by step
Solved in 3 steps with 1 images

Recommended textbooks for you
College Algebra (MindTap Course List)
Algebra
ISBN:
9781305652231
Author:
R. David Gustafson, Jeff Hughes
Publisher:
Cengage Learning

College Algebra (MindTap Course List)
Algebra
ISBN:
9781305652231
Author:
R. David Gustafson, Jeff Hughes
Publisher:
Cengage Learning