Conduct the hypothesis test and provide the test statistic and the critical value, and state the conclusion. A person randomly selected 100 checks and recorded the cents portions of those checks. The table below lists those cents portions categorized according to the indicated values. Use a 0.05 significance level to test the claim that the four categories are equally likely. The person expected that many checks for whole dollar amounts would result in a disproportionately high frequency for the first category, but do the results support that expectation? Cents portion of check 0-24 25-49 50-74 75-99 Number 64 15 11 10 Click here to view the chi-square distribution table. The test statistic is (Round to three decimal places as needed.) The critical value is (Round to three decimal places as needed.) State the conclusion. Ho. There sufficient evidence to warrant rejection of the claim that the four categories are equally likely. The results to support the expectation that the frequency for the first category is disproportionately high.
Conduct the hypothesis test and provide the test statistic and the critical value, and state the conclusion. A person randomly selected 100 checks and recorded the cents portions of those checks. The table below lists those cents portions categorized according to the indicated values. Use a 0.05 significance level to test the claim that the four categories are equally likely. The person expected that many checks for whole dollar amounts would result in a disproportionately high frequency for the first category, but do the results support that expectation? Cents portion of check 0-24 25-49 50-74 75-99 Number 64 15 11 10 Click here to view the chi-square distribution table. The test statistic is (Round to three decimal places as needed.) The critical value is (Round to three decimal places as needed.) State the conclusion. Ho. There sufficient evidence to warrant rejection of the claim that the four categories are equally likely. The results to support the expectation that the frequency for the first category is disproportionately high.

College Algebra (MindTap Course List)
12th Edition
ISBN:9781305652231
Author:R. David Gustafson, Jeff Hughes
Publisher:R. David Gustafson, Jeff Hughes
Chapter8: Sequences, Series, And Probability
Section8.7: Probability
Problem 6E: List the sample space of each experiment. Tossing three coins

Related questions
Question
100%
(reject, do not reject) H0. There (is, is not) sufficient evidence to warrant rejection of the claim that the four categories are equally likely. The results (do not appear, appear) to support the expectation that the frequency for the first category is disproportionately high.
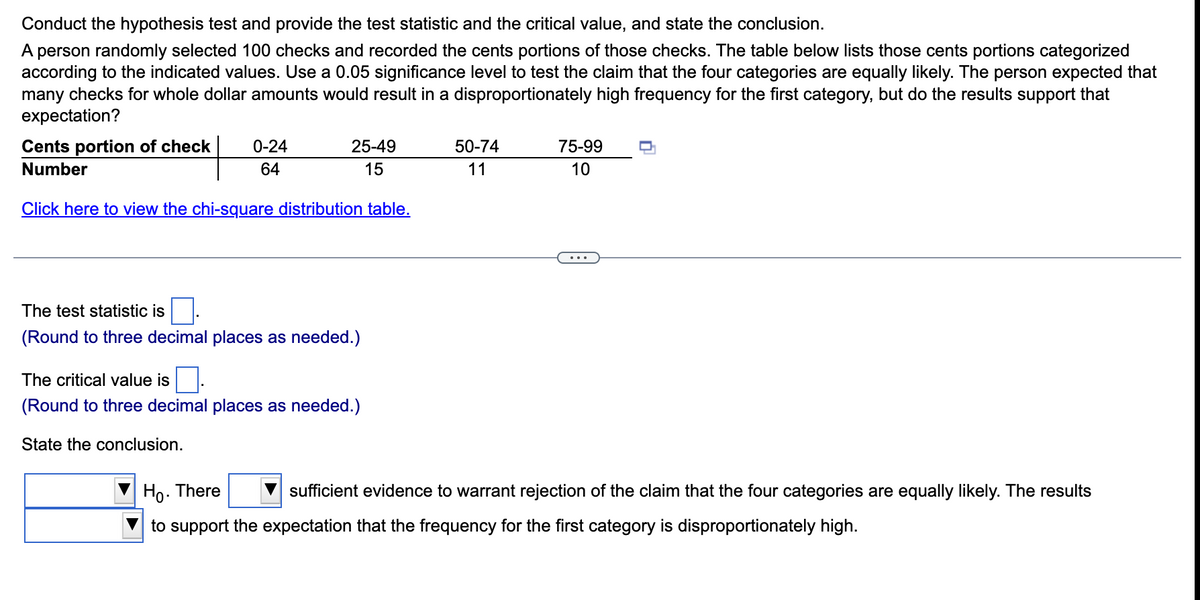
Transcribed Image Text:Conduct the hypothesis test and provide the test statistic and the critical value, and state the conclusion.
A person randomly selected 100 checks and recorded the cents portions of those checks. The table below lists those cents portions categorized
according to the indicated values. Use a 0.05 significance level to test the claim that the four categories are equally likely. The person expected that
many checks for whole dollar amounts would result in a disproportionately high frequency for the first category, but do the results support that
expectation?
Cents portion of check
0-24
25-49
50-74
75-99
Number
64
15
11
10
Click here to view the chi-square distribution table.
The test statistic is
(Round to three decimal places as needed.)
The critical value is.
(Round to three decimal places as needed.)
State the conclusion.
Ho. There
sufficient evidence to warrant rejection of the claim that the four categories are equally likely. The results
to support the expectation that the frequency for the first category is disproportionately high.
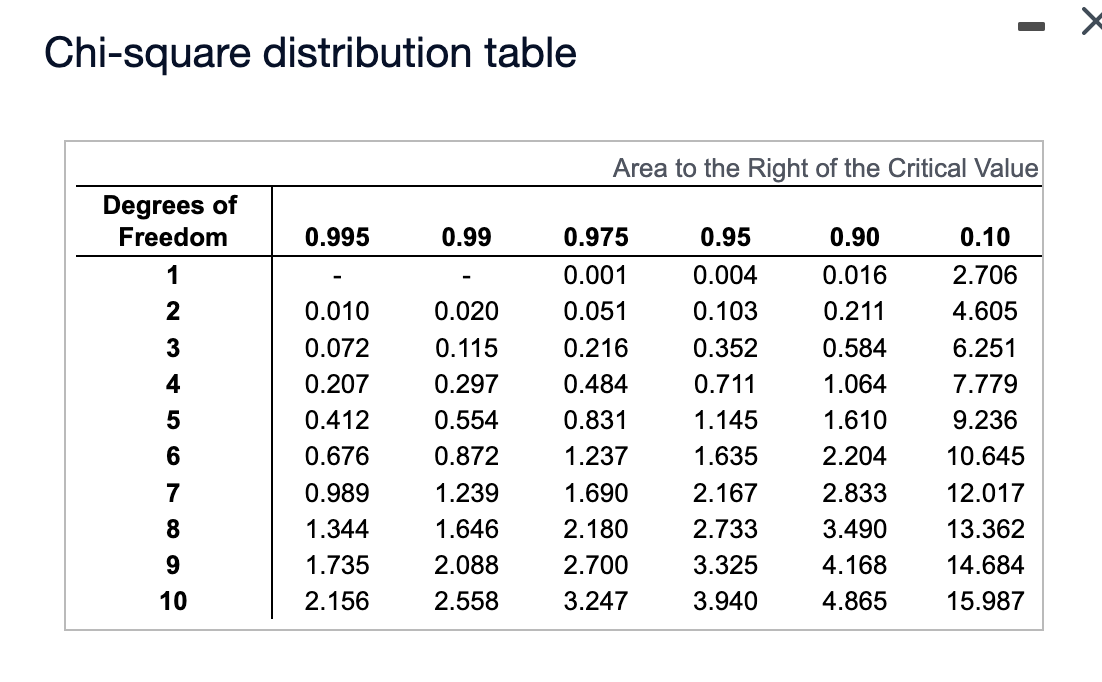
Transcribed Image Text:Chi-square distribution table
Area to the Right of the Critical Value
Degrees of
Freedom
0.995
0.99
0.975
0.95
0.90
0.10
1
0.001
0.004
0.016
2.706
2
0.010
0.020
0.051
0.103
0.211
4.605
3
0.072
0.115
0.216
0.352
0.584
6.251
4
0.207
0.297
0.484
0.711
1.064
7.779
5
0.412
0.554
0.831
1.145
1.610
9.236
0.676
0.872
1.237
1.635
2.204
10.645
7
0.989
1.239
1.690
2.167
2.833
12.017
8
1.344
1.646
2.180
2.733
3.490
13.362
1.735
2.088
2.700
3.325
4.168
14.684
10
2.156
2.558
3.247
3.940
4.865
15.987
Expert Solution
This question has been solved!
Explore an expertly crafted, step-by-step solution for a thorough understanding of key concepts.

Step by step
Solved in 2 steps

Recommended textbooks for you
College Algebra (MindTap Course List)
Algebra
ISBN:
9781305652231
Author:
R. David Gustafson, Jeff Hughes
Publisher:
Cengage Learning

College Algebra (MindTap Course List)
Algebra
ISBN:
9781305652231
Author:
R. David Gustafson, Jeff Hughes
Publisher:
Cengage Learning