Conduct the hypothesis test and provide the test statistic and the critical value, and state the condusion. A person randomly selected 100 checks and recorded the cents portions of those checks. The table below lists those cents portions categorized according to the indicated values. Use a 0.10 significance level to test the claim that the four categories are equally likely. The person expected that many checks for whole dollar amounts would result in a disproportionately high frequency for the first category, but do the results support that expectation?
Conduct the hypothesis test and provide the test statistic and the critical value, and state the condusion. A person randomly selected 100 checks and recorded the cents portions of those checks. The table below lists those cents portions categorized according to the indicated values. Use a 0.10 significance level to test the claim that the four categories are equally likely. The person expected that many checks for whole dollar amounts would result in a disproportionately high frequency for the first category, but do the results support that expectation?

MATLAB: An Introduction with Applications
6th Edition
ISBN:9781119256830
Author:Amos Gilat
Publisher:Amos Gilat
Chapter1: Starting With Matlab
Section: Chapter Questions
Problem 1P

Related questions

Topic Video
Question
Transcribed Image Text:11.1.6
Question Help ▼
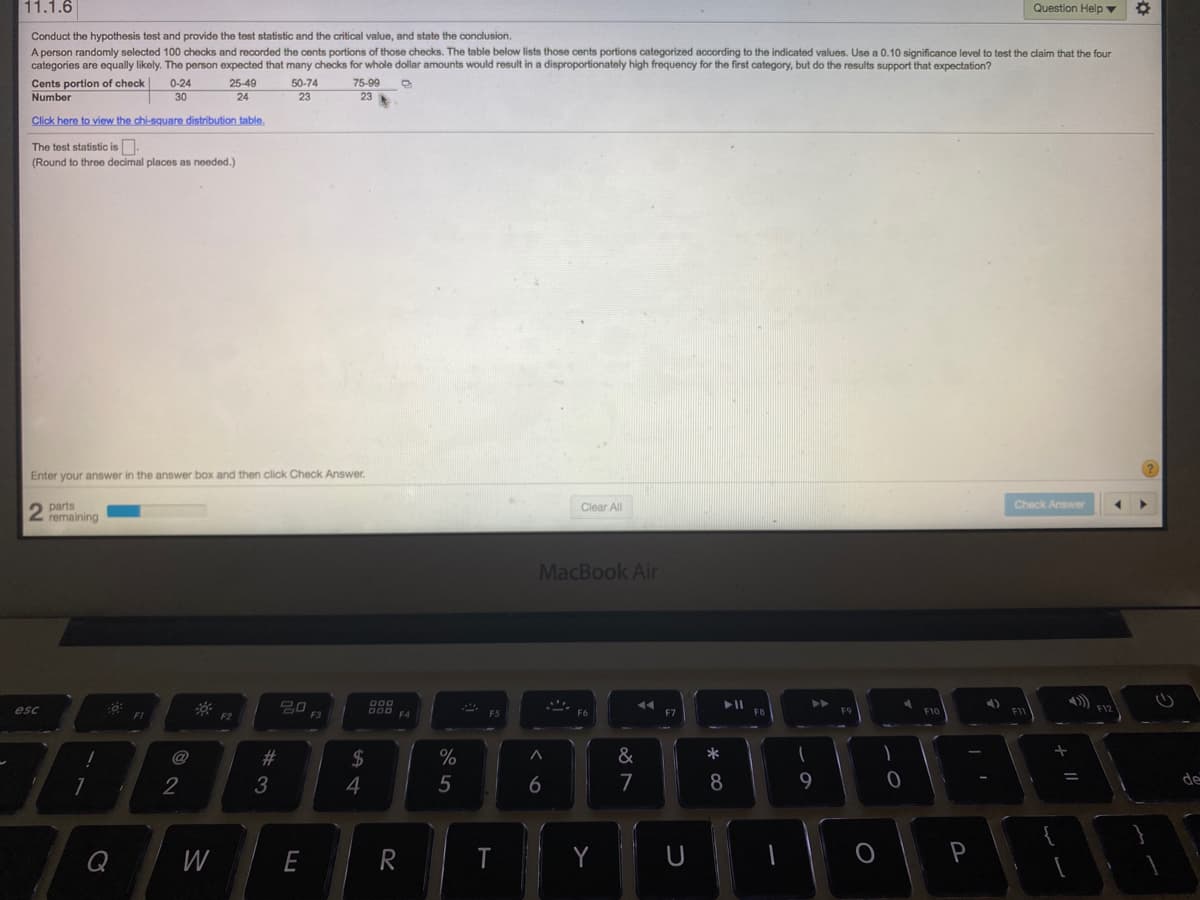
Conduct the hypothesis test and provide the test statistic and the critical value, and state the conclusion.
A person randomly selected 100 checks and recorded the cents portions of those checks. The table below lists those cents portions categorized according to the indicated values. Use a 0.10 significance level to test the claim that the four
categories are equally likely. The person expected that many checks for whole dollar amounts would result in a disproportionately high frequency for the first category, but do the results support that expectation?
Cents portion of check
Number
0-24
25-49
50-74
75-99
30
24
23
23
Click here to view the chi-square distribution table.
The test statistic is.
(Round to three decimal places as needed.)
Enter your answer in the answer box and then click Check Answer.
Check Answer
2 parts
remaining
Clear All
MacBook Air
20
888
トII
esc
F3
F7
@
23
2$
&
2
3
6
7
9
de
W
E
R.
T
Y
U
P
* C∞
Expert Solution
This question has been solved!
Explore an expertly crafted, step-by-step solution for a thorough understanding of key concepts.

This is a popular solution!

Trending now
This is a popular solution!

Step by step
Solved in 2 steps

Knowledge Booster


Learn more about
Need a deep-dive on the concept behind this application? Look no further. Learn more about this topic, statistics and related others by exploring similar questions and additional content below.Recommended textbooks for you
MATLAB: An Introduction with Applications
Statistics
ISBN:
9781119256830
Author:
Amos Gilat
Publisher:
John Wiley & Sons Inc

Probability and Statistics for Engineering and th…
Statistics
ISBN:
9781305251809
Author:
Jay L. Devore
Publisher:
Cengage Learning

Statistics for The Behavioral Sciences (MindTap C…
Statistics
ISBN:
9781305504912
Author:
Frederick J Gravetter, Larry B. Wallnau
Publisher:
Cengage Learning
MATLAB: An Introduction with Applications
Statistics
ISBN:
9781119256830
Author:
Amos Gilat
Publisher:
John Wiley & Sons Inc
Probability and Statistics for Engineering and th…
Statistics
ISBN:
9781305251809
Author:
Jay L. Devore
Publisher:
Cengage Learning
Statistics for The Behavioral Sciences (MindTap C…
Statistics
ISBN:
9781305504912
Author:
Frederick J Gravetter, Larry B. Wallnau
Publisher:
Cengage Learning

Elementary Statistics: Picturing the World (7th E…
Statistics
ISBN:
9780134683416
Author:
Ron Larson, Betsy Farber
Publisher:
PEARSON

The Basic Practice of Statistics
Statistics
ISBN:
9781319042578
Author:
David S. Moore, William I. Notz, Michael A. Fligner
Publisher:
W. H. Freeman

Introduction to the Practice of Statistics
Statistics
ISBN:
9781319013387
Author:
David S. Moore, George P. McCabe, Bruce A. Craig
Publisher:
W. H. Freeman