Confidence level Critical value 0.90 �∗=1.645 0.95 �∗=1.960 0.99 �∗=2.576 488704.2995052.qx3zqy7 Jump to level 1 A biologist wants to know the highest likely proportion of squirrels in the area that are infected with a particular disease. A random sample of 100 squirrels was tested. Use Sheet 9 of the Excel file linked above to calculate �^ and the 95% confidence interval. �^= Upper bound for 95% confidence interval = Lower bound for 95% confidence interval = The biologist can say with 95% confidence that the true population proportion of the local squirrel population that is infected with the disease is in the interval [,]. The highest likely proportion is .
Confidence level Critical value 0.90 �∗=1.645 0.95 �∗=1.960 0.99 �∗=2.576 488704.2995052.qx3zqy7 Jump to level 1 A biologist wants to know the highest likely proportion of squirrels in the area that are infected with a particular disease. A random sample of 100 squirrels was tested. Use Sheet 9 of the Excel file linked above to calculate �^ and the 95% confidence interval. �^= Upper bound for 95% confidence interval = Lower bound for 95% confidence interval = The biologist can say with 95% confidence that the true population proportion of the local squirrel population that is infected with the disease is in the interval [,]. The highest likely proportion is .

Algebra & Trigonometry with Analytic Geometry
13th Edition
ISBN:9781133382119
Author:Swokowski
Publisher:Swokowski
Chapter10: Sequences, Series, And Probability
Section10.2: Arithmetic Sequences
Problem 51E

Related questions
Question
Click this link to download the spreadsheet for use in this activity.
Critical values for quick reference during this activity.
| Confidence level | Critical value |
|---|---|
| 0.90 | �∗=1.645 |
| 0.95 | �∗=1.960 |
| 0.99 | �∗=2.576 |
488704.2995052.qx3zqy7
Jump to level 1
Click this link to download the spreadsheet for use in this activity.
Critical values for quick reference during this activity.
| Confidence level | Critical value |
|---|---|
| 0.90 | �∗=1.645 |
| 0.95 | �∗=1.960 |
| 0.99 | �∗=2.576 |
488704.2995052.qx3zqy7
Jump to level 1
A biologist wants to know the highest likely proportion of squirrels in the area that are infected with a particular disease. A random sample of 100 squirrels was tested. Use Sheet 9 of the Excel file linked above to calculate �^ and the 95% confidence interval.
�^=
Upper bound for 95% confidence interval =
Lower bound for 95% confidence interval =
The biologist can say with 95% confidence that the true population proportion of the local squirrel population that is infected with the disease is in the interval [,].
The highest likely proportion is .
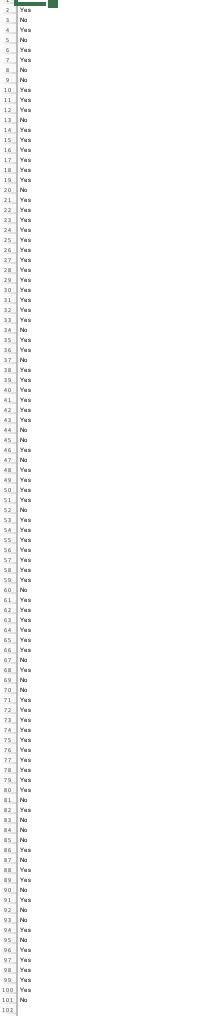
Transcribed Image Text:Yes
No
Yes
No
5
G
7 Yes
No
9
No
10 Yes
11 Yas
12 Yas
13 No
14 Yas
15 Yes
16 Yas
17 Yas
18 Yas
19 Yas
20 No
21 Yes
22 Yas
23 Yes
24 Yas
25 Yes
26 Yas
27 Yas
28 Yes
29 Yas
30 Yas
31 Yas
32 Yas
33 Yas
34 No
35 Yes
3G Yes
36
37 No
38 Yes
39 Yes
40 Yes
41 Yas
43 Yas
44 No
45 No
46 Yas
47 No
4 Yas
49 Yas
50 Yes
51 Yes
52 No
53 Yes
54 Yas
55 Yes
56 Yes
57 Yes
58 Yes
59 Yes
GO No
61 Yas
62 Yas
63 Yes
64 Yas
65 Yas
GG You
67 No
GE Yes
69 No
70 No
71 Yas
72 Yes
73 Yas
74 Yas
75 Yas
76 Yes
77 Yes
78 Yas
79 Yas
So Yes
81 No
82 Yas
83 No
84 No
85 No
BG Yes
87 No
Yes
89 Yes
90 No
91 Yes
92 No
93 No
94 Yas
95 No
96 Yes
97 Yes
98 Yas
99 Yas
100 Yas
101 No
102
Expert Solution
This question has been solved!
Explore an expertly crafted, step-by-step solution for a thorough understanding of key concepts.

This is a popular solution!

Trending now
This is a popular solution!

Step by step
Solved in 3 steps with 5 images

Recommended textbooks for you
Algebra & Trigonometry with Analytic Geometry
Algebra
ISBN:
9781133382119
Author:
Swokowski
Publisher:
Cengage

Algebra and Trigonometry (MindTap Course List)
Algebra
ISBN:
9781305071742
Author:
James Stewart, Lothar Redlin, Saleem Watson
Publisher:
Cengage Learning

Elementary Linear Algebra (MindTap Course List)
Algebra
ISBN:
9781305658004
Author:
Ron Larson
Publisher:
Cengage Learning
Algebra & Trigonometry with Analytic Geometry
Algebra
ISBN:
9781133382119
Author:
Swokowski
Publisher:
Cengage
Algebra and Trigonometry (MindTap Course List)
Algebra
ISBN:
9781305071742
Author:
James Stewart, Lothar Redlin, Saleem Watson
Publisher:
Cengage Learning
Elementary Linear Algebra (MindTap Course List)
Algebra
ISBN:
9781305658004
Author:
Ron Larson
Publisher:
Cengage Learning