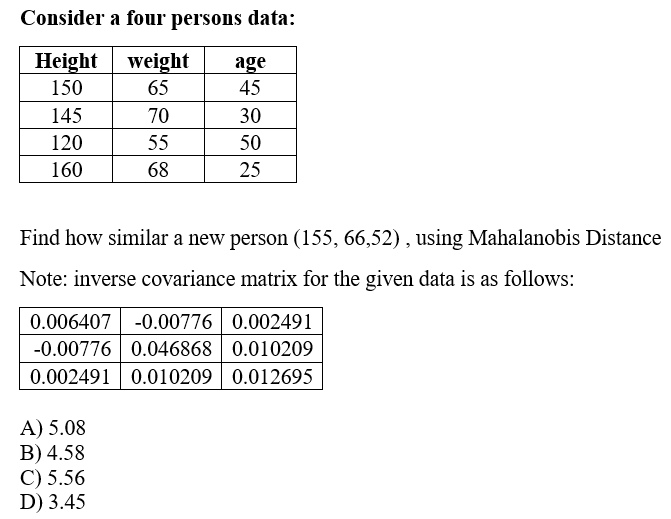
Consider a four persons data: Height weight age 45 150 65 145 70 30 120 55 50 160 68 25 Find how similar a new person (155, 66,52) , using Mahalanobis Distance Note: inverse covariance matrix for the given data is as follows: -0.00776 0.002491 -0.00776 0.046868 | 0.010209 0.002491| 0.010209 | 0.012695 0.006407 A) 5.08 В) 4.58 C) 5.56 D) 3.45


Q: 76 90 69 86 64 77 75 79 82 70 80 96 62 76 51 65 isb md 2uluols ot to m 1odionn-2ooube 64 68 95 74…
A: INTRODUCTION : It is often useful to represent a frequency distribution by diagram HISTOGRAM :…
Q: The following are the data and consist of recorded values of age (months) by group: Active Group…
A: The following information has been given: Active Group Passive Group No-Exercise Group 8 Week…
Q: eam Name Division W L PCT Attendance Buffalo Bisons North 66 77 0.462 8818 Lehigh Valley IronPigs…
A: Note: AS per the guidelines, we are allowed to answer single question at a time. Kindly repost the…
Q: 2.28 The following data give the number of turnovers (fumbles and interceptions) by a ecollege…
A: The single-value classes means each class has one observation only. The frequency is the number of…
Q: Ten large industrial corporations yield the following data: Company | Sales (in Millions $) |…
A: Since you have posted a question with multiple sub-parts, we will solve first three subparts for…
Q: A sample of 40 100-watt light bulbs produced by Manufacturer A and a sample of 40 100-watt light…
A:
Q: Draw a graph with the following given adjacency matrix. 0111 1001 1001 1110
A:
Q: Convert the matrix of observations to mean-deviation form, and construct the sample covariance…
A: Answer:-
Q: Consider the following data 14 14 3 14 10 10
A: The given information is entered into the excel sheet as follows:
Q: The following binary data represent the students taking a statistics course in a major university,…
A: Introduction: Denote p̂ as the sample proportion of students represented by “1”, that is, for…
Q: The covariance matrix of an image with three spectral components is shown below. Let x₁, x2, and x3…
A: The new variable of Y1 will be y1=0.54x1-0.78x2+0.32x3.
Q: Calculate Karl Pearson's coefficient of skewness of the following data : 25 15 23 40 27 25 23 25 20
A:
Q: The following binary data represent the students taking a statistics course in a major university,…
A: Given Information: Consider p as the proportion of students represented by "1" for students who are…
Q: please highlight the correct answer
A: Given that,
Q: The following data give the percentage of women working in five companies in the retail and trade…
A: (a) Use EXCEL to construct the scatter plot. EXCEL procedure: Go to EXCEL Go to Insert menu…
Q: Consider the o doiane following Year 1790 1800 Population Cin millions ) 3.१2१। 5.308 7.240 1810…
A: Logistic population growth equation is of the form p(t)=a1+e-(b+ct)where a, b and c are the…
Q: a) Let X = X,, X,, X, be a random vector and %3! let the data matrix for X be 2 5 3 4 2 4 2 3 Obtain…
A:
Q: The linkage data below (shown in cM) were obtained in a series of two-point crosses designed to…
A:
Q: Q3. Use the following data set of 6 observations relating to 7 variables to construct a similarity…
A: Consider the given data set, Observation A B C D E F G 1 1 1 0 0 1 0 0 2 1 1 1 1 0 0 1 3 1…
Q: Gender Weight Height Age Blood Type Female 50 170 21 O a Male 80 175 20 A Female 60 180 21 O Male 70…
A: (Since it has been not mentioned which question so, as per our protocol we shall only answer the…
Q: matrix for a portfolio with 50 stocks requires the calculations of ____ variances an
A: Given that the σ_AB= σ_BA, then the variance-covariance matrix for a portfolio with 50 stocks…
Q: Q.12 Construct chain base indices for the following years taking 1940 as base: 1944 Year 1940 1941…
A: Solution : Given : Base year = 1940 Formula for chain base index number : = Price in the current…
Q: [M] The covariance matrix below was obtained from a Landsat image of the Columbia River in…
A:
Q: 29. Find the adjacency matrix for the graph below. * (B
A: Adjacency Matrix: The adjacency matrix is also referred as a connection matrix that connects a…
Q: 1. Let L be the following Leslie matrix [0.2 0.3 0.2 ] L = 0.6 0.8 Is there a stable age…
A: The complete solutions are given below
Q: sample covariance matrix S as s- () 4 S = 6
A: We know that , in 2*2 order matrix to obtain the correlation matrix from the covariance matrix, We…
Q: The ages of 30 patients admitted to a certain hospital during a particular week were as follows; 48…
A: The ages of 30 patients admitted to a certain hospital during a particular week are given. We have…
Q: Convert the matrix of observations to mean-deviation form, and construct the sample covariance…
A:
Q: [1 The matrix 3 is a 4 3 variance-covariance matrix of two random variables.
A: Hello! As you have posted 2 different questions, we are answering the first question (d). In case…
Q: Let there be three levels of the row variable and four levels of the column variable in a crosstab.…
A: It is been asked to find the sample size using given information.
Q: Estimation of the model resulted in the following least squares estimates and corresponding…
A: Given the regression model yi=β1+β2x2i+β3x3i+εi and b1b2b3=442 cov^b1,b2,b3=4-11-140104
Q: The covariance matrix of an image with three spectral components is shown below. Let x₁, x2, and x…
A:
Q: The table below shows Layla's grades on different subjects this 1st semester. Subjects Units…
A:
Q: Instructions to the student: 1. Open a new excel file 2. Create a table for the following data in…
A: Since you have posted a question with multiple sub-parts, we will solve first three subparts for…
Q: Convert the matrix of observations to mean-deviation form, and construct the sample covariance…
A: By using formulaes and matrix calculations you can solve the given problem as follows :
Q: Use the given covariance matrix to compute the percentage of the total variance that is contained in…
A:
Q: Given that £p =(13.3 5.55) for the sample of forged ten 5.8 5.55 pound notes, calculate the pooled…
A:
Q: The average download speed is ___ mbps and the average upload speed is ___ mbps. The difference…
A: Compute the value of average download speed: The data represents the values of download speed and…
Q: Question 1 The thrust of a jet turbine engine is thought to be related to the primary speed of…
A:
Q: Question 1. Consider a p-dimensional response variable j, containing p variables, with n observation…
A: Given, a 3X3 data matrix containing three observations of three variables y1 , y2 and y3 .…
Q: (a) Suppose that we ignore the fact that the data were collected in pairs and mistakenly treat this…
A: (a) Let μ1 be the population mean for group 1, and μ2 be the population mean for group 2. The test…
Q: Team Name Division W L PCT Attendance Buffalo Bisons North 66 77 0.462 8818 Lehigh Valley IronPigs…
A:
Q: The data below represents the number of 50kg bags of maize produced by 100 small scale farmers in…
A: As per guidelines we will solve first question only, please repost other questions for more answers.…
Q: Question 1. Consider a p-dimensional response variable j, containing p variables, with n observation…
A:
Q: The following measurements x1 and x2 were made on a sample of four genuine ten pound notes. 2.…
A:
Q: Given data points (2,-1), (2, 1), (3,2), (0,-1), and (3,-1), compute the sample covariance matrix.…
A:
Q: The following table reports the sale of umbrellas for 16 quarters. Quarter Year 1 Year 2 Year 3 Year…
A: Given table: Quarter Year 1 Year 2 Year 3 Year 4 1 12 9 6 5 2 9 5 3 2 3 7 4 1 1 4 10 7 5…
Q: The table below summarises the height, X₁ (in inches), and the weight, X2 (in pounds) of a random…
A: Solution: From the given information,
Q: Given data points (1, 3), (0, -1). (2. 1). (4. 1). (-2. 1), center the data and compute the sample…
A: Given data points (1,3), (0, -1), (2, 1), (4,1), (-2,1), center the data.


Trending now
This is a popular solution!

Step by step
Solved in 2 steps

- Question 18 A researcher reported the following covariance matrix for her 3-item (7-option Likert item responses) test. Item1 Item2 Item3 Item4 Item1 3.84 2.63 1.89 2.14 Item2 2.63 3.62 2.10 2.25 Item3 1.89 2.10 3.68 2.52 Item4 2.14 2.25 2.52 3.80 What is the value of coefficient alpha? Question 19 In which of the following test assumptions is coefficient alpha NOT equal to reliability?The following data show a list of 30 observations and an estimated probability of Class 1 membership produced by the classification algorithn. a) Create confusion matrices for cutoff values of 0.75, 0.5, and 0.25. b) Find the the followings for each cutoff values: Class 1 error rate, Class 0 error rate, and overall error rate Sensitivity = ? Specificity = ? Precision = ? F1 Score = ? c) What do you observe? Explain. Actual Class Probability of Class 1 1 1 1 1 1 1 0 0.9 0 0.87 1 0.86 1 0.85 0 0.84 1 0.84 1 0.83 1 0.82 0 0.81 0 0.8 0 0.8 0 0.78 0 0.77 0 0.74 1 0.69 1 0.68 1 0.65 0 0.64 0 0.6 0 0.55 0 0.5 0 0.4 1 0.38 0 0.35 0 0.24 0 0.22 1 0.1You are asked to evaluate 'Introduction to the Matrix' from the statistical data of thefollowing 7 'Introduction to the Matrix' course grade distributions: Class A Class B Class C Class D Class E Class F Class GMean 71.8 75.2 73.8 82.2 79.6 78.0 73.7Median 79.3 78.5 80.1 83.4 81.4 77.6 75.9Mode 80.1 78.5 80.5 83.0 81.0 78.0 70.0Std Dev 18.6 15.9 15.5 5.1 11.4 7.0 15.1Students 24 23 14 17 29 18 13 (a) With 95% Statistical Confidence would you conclude that all Seven (7) CourseResults are consistent with the Same Student Population (Do these results comefrom the same population)? (b) Provide your conclusion (a) in up to 100 words.
- You are asked to evaluate 'Introduction to the Matrix' from the statistical data of thefollowing seven (7) 'Introduction to the Matrix' course grade distributions: Class A Class B Class C Class D Class E Class F Class G Mean 71.8 75.2 73.8 82.2 79.6 78.0 73.7 Median 79.3 78.5 80.1 83.4 81.4 77.6 75.9 Mode 80.1 78.5 80.5 83.0 81.0 78.0 70.0 Std Dev 18.6 15.9 15.5 5.1 11.4 7.0 15.1 Students 24 23 14 17 29 18 13 Provide statistical metrics and analysis presentation (tables, graphs,etc.) you would use for this.You are asked to evaluate 'Introduction to the Matrix' from the statistical data of thefollowing seven (7) 'Introduction to the Matrix' course grade distributions: Class A Class B Class C Class D Class E Class F Class G Mean 71.8 75.2 73.8 82.2 79.6 78.0 73.7 Median 79.3 78.5 80.1 83.4 81.4 77.6 75.9 Mode 80.1 78.5 80.5 83.0 81.0 78.0 70.0 Std Dev 18.6 15.9 15.5 5.1 11.4 7.0 15.1 Students 24 23 14 17 29 18 13 Which 3 'Introduction to the Matrix' classes would you most likely suspectto be possible outliers from these 7 classes?Need help with parts d and k. Data: TSERofReturn AcmeRofReturn 1 0.42478 -0.48194 2 1.61213 -0.73284 3 -0.98754 -2.28445 4 -0.30013 -1.55312 5 1.41215 0.68674 6 0.68725 -1.31132 7 0.03733 -0.83295 8 -1.72494 -1.71975 9 0.33729 1.14443 10 -1.07502 -1.79885 11 0.86222 0.89736 12 1.17468 1.66664 13 -0.38761 -0.02658 14 1.66212 0.9086 15 1.09969 1.99935 16 -0.06266 0.46148 17 -1.96241 -1.41004 18 -1.32499 -0.38086 19 -1.51247 -1.90904 20 0.74974 0.91873 21 -0.38761 -0.49714 22 -0.17514 -1.31385 23 -3.41222 -1.15681 24 -0.01266 2.11718 25 0.16231 1.78766 26 -0.82506 1.30344 27 -0.41261 -0.43377 28 0.2623 -1.70274 29 -1.16251 0.4692 30 -1.05003 0.27671 31 -0.65008 -0.63741 32 0.62475 2.9895 33 -0.68758 1.3613 34…
- A tea company appoints four salesmen A, B, C and D and observes their sales in three months, April, May and June: Months Salesmen A B C D April May June 36 28 26 36 29 28 21 31 29 35 32 29 2 For the two –way analysis of variance model with one observation per cell, we write the observation from the th j group and th i block as ij i j ijY µ β τ ε = + + + (a) Explain each term in the above model in the context of the given information. (b) Consider the observation on agent B and house 1 ( ) 21 28Y = i. Estimate µ ii. Estimate and interpret 2 βThe following shows the Excel spreadsheet for Education and Income . A B C 1 Individual i Education (x) Income (y) 2 1 3 45 3 2 4 56 4 3 6 85 5 4 2 35 6 5 5 57 7 6 4 48 8 7 8 100 9 8 0 38 10 11 =COVARIANCE.S(C2:C9,B2:B9) 12 =CORREL(C2:C9,B2:B9) Group of answer choices The formula in B11 is “=covariance.s(C2:C9,B2:B9)”. It gives the variance of Education and the variance of Income. The values are 51.4287 and 0.9137. The formula in B11 is “=covariance.s(C2:C9,B2:B9)”. It gives the correlation between Education and the variance of Income. The value is 0.9137 The formula in B12 is “=correl(C2:C9,B2:B9)”. It gives the covariance between Education and Income. The value is 51.4286. The formula in B12 is “=correl(C2:C9,B2:B9)”. It gives the correlation between Education and Income. The value is 0.9137.Q3. Use the following data set of 6 observations relating to 7 variables to construct a similarity matrix by: Matching Coefficient method. Jaccard’s Coefficient method. Observation A B C D E F G 1 1 1 0 0 1 0 0 2 1 1 1 1 0 0 1 3 1 0 1 0 0 0 0 4 0 1 0 0 1 1 0 5 0 0 0 1 1 1 1 6 0 0 0 1 0 1 0
- A study showed the following migration matrix, which describes the movement of the population of the United States during 1989. In 1989, about 16.3% of the total population lived in State A. What percentage of the total population would eventually live in State A if the listed migration probabilities were to remain constant over many years?The four brands of soap have the current market share of 0.23, 0.28, 0.25, and 0.24 for brands A, B, C, and D, respectively. Below are the transition probability matrix of the soap brands based on their annual performance and the number of customers using the brands.From/To A B C D Number of Customers A 0.2 0.3 0.1 0.4 2300 B 0 0.2 0.5 0.3 2800 C 0.3 0.5 0 0.2 2500 D 0.3 0.4 0.3 0 2400 a) What is the market share of Brand D in the long run? Answer in 2 decimal places.b) How many customers will shift preference in using Brand C soap in the long run?c) What is the mean return time of Brand 1? Answer in 2 decimal places.d) What is the percentage change of Brand B? Answer in 2 decimal places.Calculate 1) (AA)A’2) Find the trace of matrix ∑, what does the trace of a covariance matrix represent?