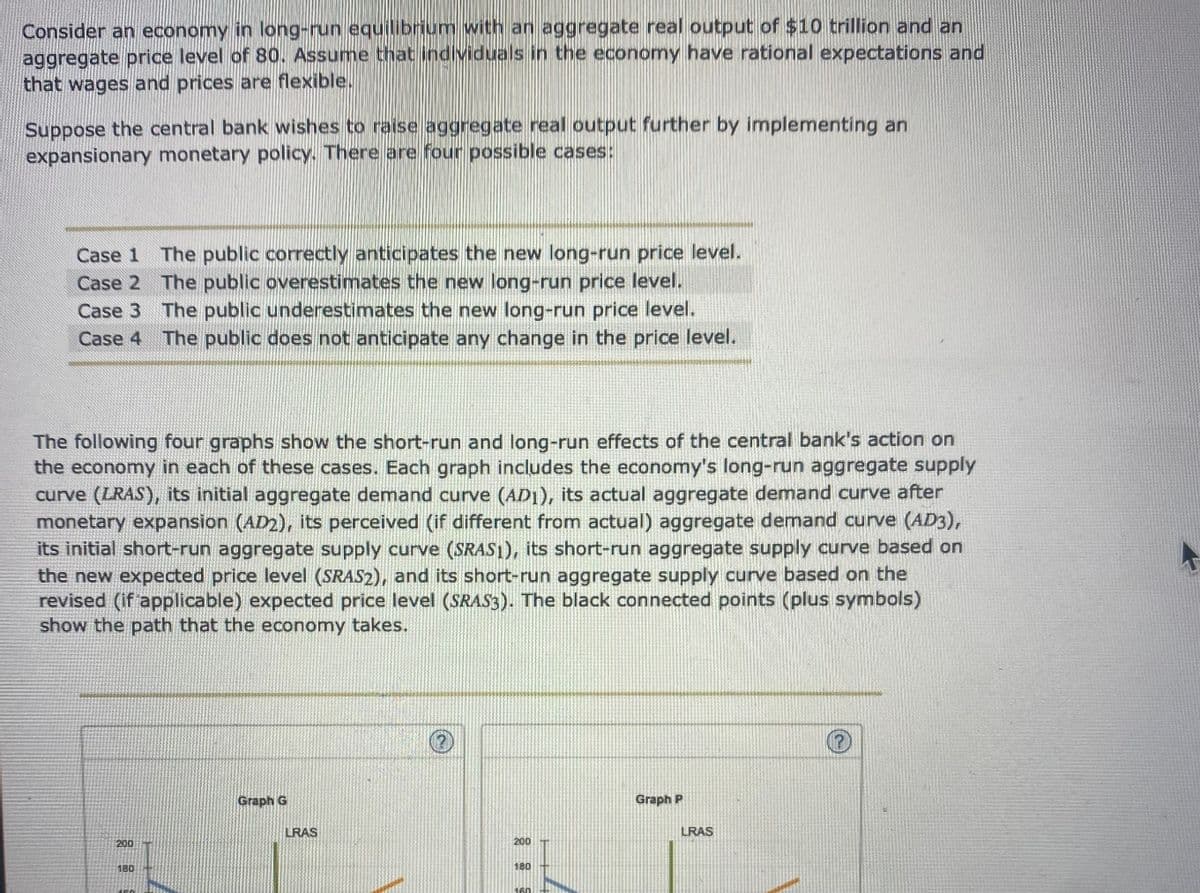
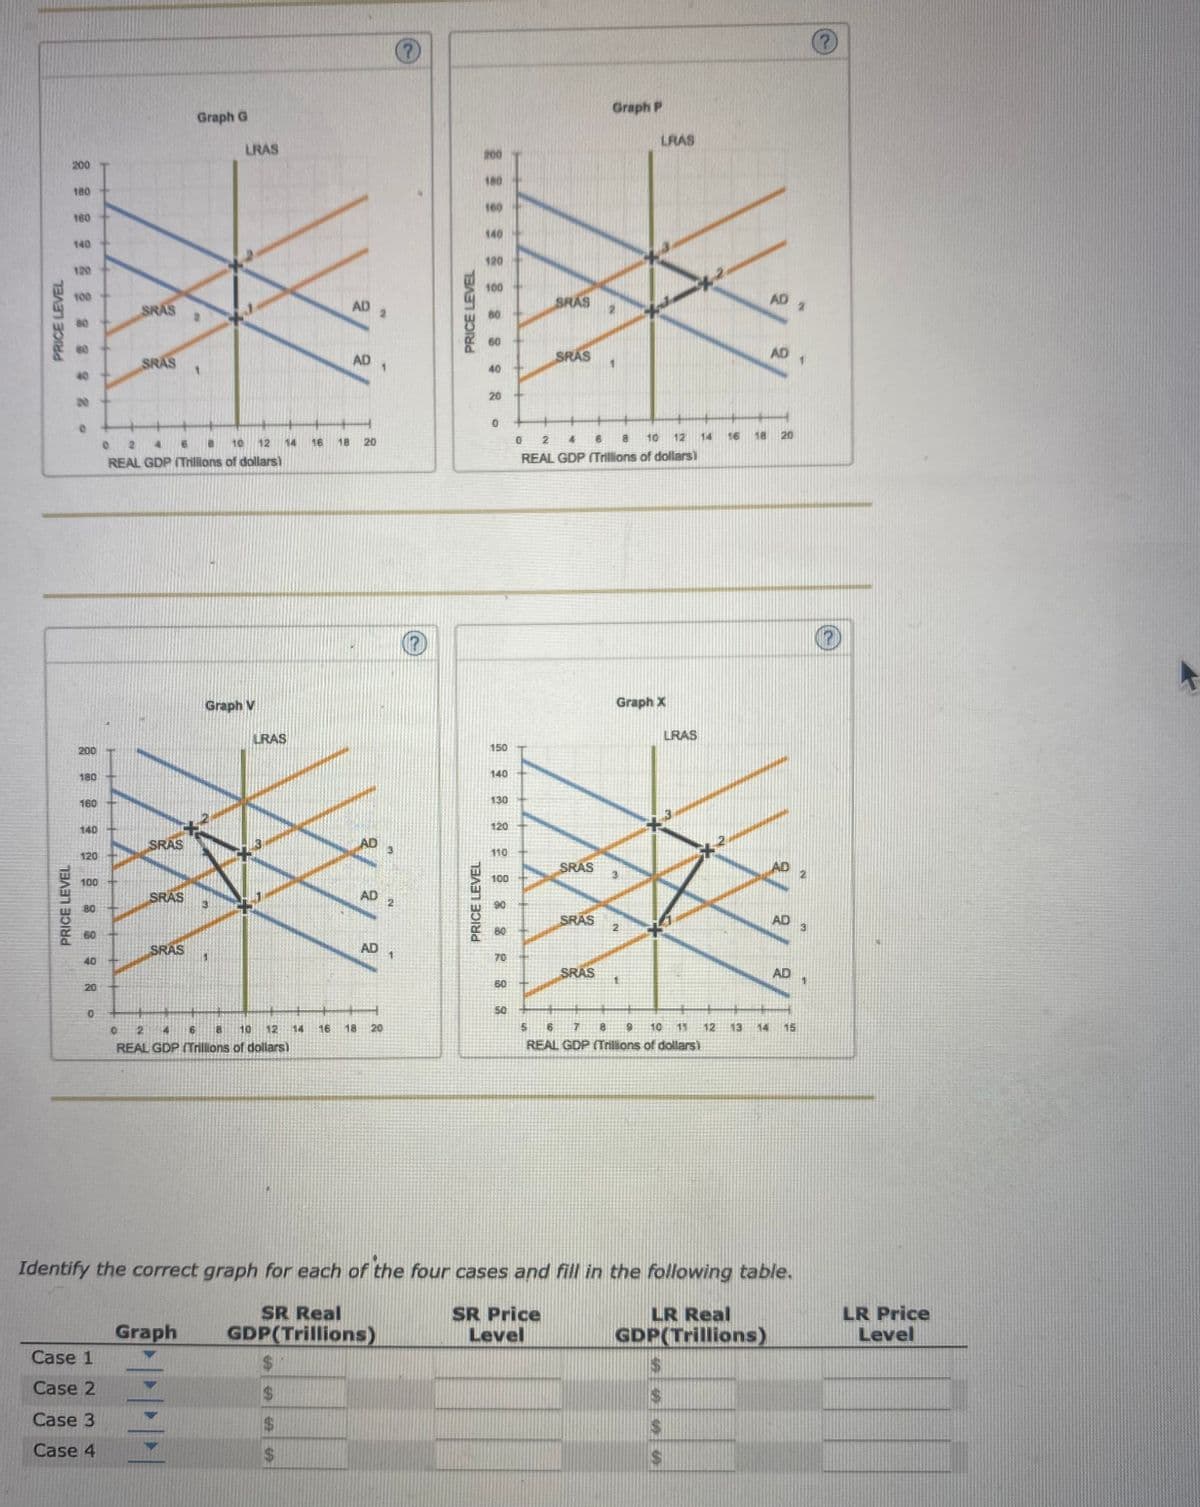
Consider an economy in long-run equilibrium with an aggregate real output of $10 trillion and an aggregate price level of 80. Assume that individuals in the economy have rational expectations and that wages and prices are flexible. Suppose the central bank wishes to raise aggregate real output further by implementing an expansionary monetary policy. There are four possible cases: Case 1 The public correctly anticipates the new long-run price level. The public overestimates the new long-run price level. Case 2 Case 3 The public underestimates the new long-run price level. Case 4 The public does not anticipate any change in the price level. The following four graphs show the short-run and long-run effects of the central bank's action on the economy in each of these cases. Each graph includes the economy's long-run aggregate supply curve (LRAS), its initial aggregate demand curve (AD1), its actual aggregate demand curve after monetary expansion (AD2), its perceived (if different from actual) aggregate demand curve (AD3), its initial short-run aggregate supply curve (SRAS1), its short-run aggregate supply curve based on the new expected price level (SRAS2), and its short-run aggregate supply curve based on the revised (if applicable) expected price level (SRAS3). The black connected points (plus symbols) show the path that the economy takes. Graph G LRAS H Graph P LRAS (?)
Consider an economy in long-run equilibrium with an aggregate real output of $10 trillion and an aggregate price level of 80. Assume that individuals in the economy have rational expectations and that wages and prices are flexible. Suppose the central bank wishes to raise aggregate real output further by implementing an expansionary monetary policy. There are four possible cases: Case 1 The public correctly anticipates the new long-run price level. The public overestimates the new long-run price level. Case 2 Case 3 The public underestimates the new long-run price level. Case 4 The public does not anticipate any change in the price level. The following four graphs show the short-run and long-run effects of the central bank's action on the economy in each of these cases. Each graph includes the economy's long-run aggregate supply curve (LRAS), its initial aggregate demand curve (AD1), its actual aggregate demand curve after monetary expansion (AD2), its perceived (if different from actual) aggregate demand curve (AD3), its initial short-run aggregate supply curve (SRAS1), its short-run aggregate supply curve based on the new expected price level (SRAS2), and its short-run aggregate supply curve based on the revised (if applicable) expected price level (SRAS3). The black connected points (plus symbols) show the path that the economy takes. Graph G LRAS H Graph P LRAS (?)

Chapter20: Monetary Policy
Section20.A: Policy Disputes Using The Self Correcting Aggregate Demand And Supply Model
Problem 4SQP

Related questions
Question
Confused and not sure what the correct answers are
Transcribed Image Text:Consider an economy in long-run equilibrium with an aggregate real output of $10 trillion and an
aggregate price level of 80. Assume that individuals in the economy have rational expectations and
that wages and prices are flexible.
Suppose the central bank wishes to raise aggregate real output further by implementing an
expansionary monetary policy. There are four possible cases:
Case 1 The public correctly anticipates the new long-run price level.
Case 2 The public overestimates the new long-run price level.
Case 3 The public underestimates the new long-run price level.
Case 4 The public does not anticipate any change in the price level.
The following four graphs show the short-run and long-run effects of the central bank's action on
the economy in each of these cases. Each graph includes the economy's long-run aggregate supply
curve (LRAS), its initial aggregate demand curve (AD1), its actual aggregate demand curve after
monetary expansion (AD2), its perceived (if different from actual) aggregate demand curve (AD3),
its initial short-run aggregate supply curve (SRAS1), its short-run aggregate supply curve based on
the new expected price level (SRAS2), and its short-run aggregate supply curve based on the
revised (if applicable) expected price level (SRAS3). The black connected points (plus symbols)
show the path that the economy takes.
200
180
120
Graph G
LRAS
200
180
Graph P
(?)
Transcribed Image Text:PRICE LEVEL
PRICE LEVEL
200
180
160
140
2 2 2 2 2 2 -
120
200
180
160
140
120
100
0
SRAS
Case 1
Case 2
Case 3
Case 4
SRAS
SRAS
16
0 24
10 12
REAL GDP (Trillions of dollars)
SRAS
SRAS
Graph G
Graph
8
Graph V
3
1
LRAS
6 18
14
LRAS
0 2
REAL GDP (Trillions of dollars)
$
$
$
$
16
16
AD 2
AD
18 20
18
AD
AD
AD 1
PRICE LEVEL
PRICE LEVEL
200
180
100
140
120
60
40
20
0
150
140
130
100
0
5
SRAS
SRAS
10 12
6
2
REAL GDP (Trillions of dollars)
SR Price
Level
SRAS
SRAS
Graph P
SRAS
2
LRAS
Graph X
2
7
8 9
REAL GDP (Trillions of dollars)
LRAS
14
$
$
$
13
18
AD 2
AD
Identify the correct graph for each of the four cases and fill in the following table.
SR Real
GDP(Trillions)
LR Real
GDP(Trillions)
20
AD
AD
AD
2
3
1
(?
LR Price
Level
T
Expert Solution
This question has been solved!
Explore an expertly crafted, step-by-step solution for a thorough understanding of key concepts.

This is a popular solution!

Trending now
This is a popular solution!

Step by step
Solved in 2 steps with 1 images

Knowledge Booster


Learn more about
Need a deep-dive on the concept behind this application? Look no further. Learn more about this topic, economics and related others by exploring similar questions and additional content below.Recommended textbooks for you

Exploring Economics
Economics
ISBN:
9781544336329
Author:
Robert L. Sexton
Publisher:
SAGE Publications, Inc
Exploring Economics
Economics
ISBN:
9781544336329
Author:
Robert L. Sexton
Publisher:
SAGE Publications, Inc