Consider independent trials, each of which results in outcome i, i = 0, 1, .., k, with probability Pi, where o Pi = 1. Let N denote the number of trials needed to obtain an outcome that is not equal to 0, and let X be that outcome. (a) Find P(N = n), n > 1 %3D (b) Find P(X = j),j = 1, ..., k (c) Show that P(N = n, X = j) = P(N = n)P(X = j)
Consider independent trials, each of which results in outcome i, i = 0, 1, .., k, with probability Pi, where o Pi = 1. Let N denote the number of trials needed to obtain an outcome that is not equal to 0, and let X be that outcome. (a) Find P(N = n), n > 1 %3D (b) Find P(X = j),j = 1, ..., k (c) Show that P(N = n, X = j) = P(N = n)P(X = j)

Glencoe Algebra 1, Student Edition, 9780079039897, 0079039898, 2018
18th Edition
ISBN:9780079039897
Author:Carter
Publisher:Carter
Chapter10: Statistics
Section10.1: Measures Of Center
Problem 9PPS

Related questions
Question
D5)
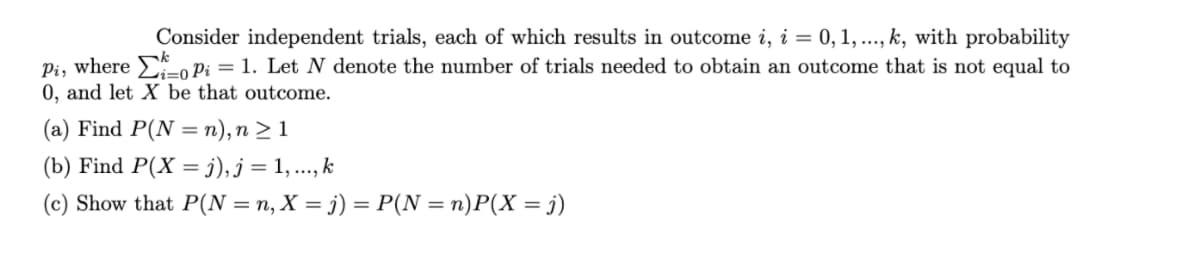
Transcribed Image Text:Consider independent trials, each of which results in outcome i, i = 0, 1, ..., k, with probability
Pi, where , Pi = 1. Let N denote the number of trials needed to obtain an outcome that is not equal to
0, and let X be that outcome.
(a) Find P(N = n),n > 1
%3D
(b) Find P(X = j),j = 1, ..., k
(c) Show that P(N = n, X = j) = P(N = n)P(X = j)
Expert Solution
This question has been solved!
Explore an expertly crafted, step-by-step solution for a thorough understanding of key concepts.

This is a popular solution!

Trending now
This is a popular solution!

Step by step
Solved in 2 steps with 2 images

Recommended textbooks for you
Glencoe Algebra 1, Student Edition, 9780079039897…
Algebra
ISBN:
9780079039897
Author:
Carter
Publisher:
McGraw Hill
Glencoe Algebra 1, Student Edition, 9780079039897…
Algebra
ISBN:
9780079039897
Author:
Carter
Publisher:
McGraw Hill