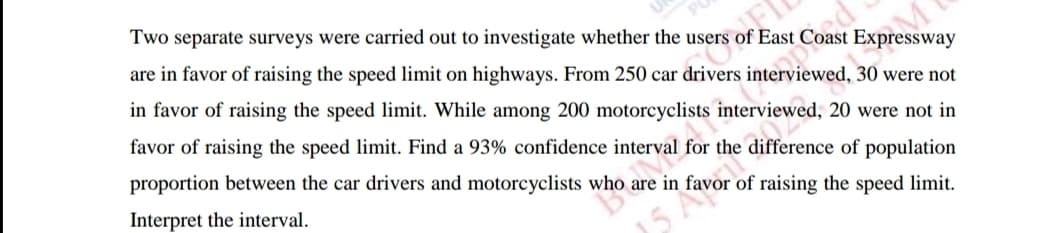
Two separate surveys were carried out to investigate whether the users of East Coast Expressway are in favor of raising the speed limit on highways. From 250 car drivers interviewed, 30 were not in favor of raising the speed limit. While among 200 motorcyclists interviewed, 20 were not in favor of raising the speed limit. Find a 93% confidence interval for the difference of population proportion between the car drivers and motorcyclists who are in favor of raising the speed limit. Interpret the interval.
Q: Question 6 0 A raft is floating on the ocean. Its distance compared to the height of the dock is…
A:
Q: GIven the following ANOVA table: Source DF MS Regression 1,800.0 900.0 1 1,800.00 20.00 Error 10…
A: Anova table is given in the question.
Q: 3. Given n = 36, ī = 786, o = 48, µ = 800 to test the hypothesis that µ = 800 against µ # 800. What…
A: For given data which test statistic be used
Q: Theorem :-2t , s are The values al te yandom sample from binomial population Ef The varient x taking…
A:
Q: A kindergarten class has four left-handed children and twelve right-handed children. Two children…
A: Given: Let X = the number who are left-handed. Class has four left-handed children and twelve…
Q: poth servers are busy when yo s a single waiting line, and yo
A: Two Registers are maintained: R1 and R2 A random variable XX is said to follow an exponential…
Q: Using the standard normal distribution table, the critical value zα/2 needed to construct a 99%…
A:
Q: , or intelligence quotient, is one way to measure a person’s ability to reason and problem solve.…
A: Given that Population standard deviation =15 Sample size n =20 Population mean =100
Q: Determine the variance, standard deviation and coefficient variation
A: Obtain the value of the standard deviation. Use EXCEL Procedure for finding the value of standard…
Q: Questions 15-18 use the following information. Suppose in a sample of 5 men that their monthly…
A: Solution: Given information: k= 2 independent variables n= 5 observation.
Q: Develop a random variate generator for a random variable X with the pdf (x) =-2 ifx2 0. if x < 0,…
A: Given that
Q: 9. Which of the following pair of null and alternative hypotheses is correctly stated? А. Н, : и 3…
A:
Q: The claim is a mean is 222 and you want to prove it is less. Test the hypothesis within a 10% level…
A: Given information Mean ( mu ) = 222 Sample mean (xbar) = 213.12 Standard deviation (s) =79.92…
Q: The following data represent the number of days absent per year in a population of six employees of…
A: We have given data are 1,3,5,6,7,10 Mean for the given data is µ = ∑x/n = (1+3+5+6+7+10)/6 = 5.33
Q: According to the following two way table, what percentage of people in the sample is taking naps.…
A: Solution-: We have following table: Male Female Take naps 25 30 Does not take naps 35 10…
Q: Find the following probabilities for test scores X, for which the mean is 400 and the standard…
A: Note:(1). According to Bartleby expert guidelines, we can answer only first question with their…
Q: The number of reviews for each of the local bowling alleys are counted. The results are normally…
A: Mean(µ) = 25Standard deviations (σ) = 4X ~ N (µ, σ )= N(25, 4)
Q: A data set is normally distributed with a mean of 63 and a standard deviation of 10.4. What…
A: Solution-: Given: μ=63,σ=10.4 We find percentage of data is between 45 and 77?
Q: What do you think “95% confident” means?
A: The provided graph represents 95% confidence interval of sample proportion for 100 samples.
Q: According to a Harvard Health Publishing article, the normal body temperature may be lower than…
A:
Q: sample results, a statistician found for the population mean a confidence interval extending from…
A: Given: Random variable x from normal distribution with population standard deviations ?=24.64…
Q: In a certain allergy survey, about 9% said that they experienced "severe" allergy symptoms. The…
A: Given that ; Sample size (n) = 845 Proportion = 9 % By using proportion test we solve this problem…
Q: If instead of 25, 80 male runners are selected for the study, what is the sampling error at 95%…
A: Given that Sample size n = 80 Sample mean = 53 Population SD = 5.5 Margin of error E = 0.8 The…
Q: elsewhere . If Z = X + 2Y, then what is the joint density of X and Z where nonzero?
A:
Q: Two separate surveys were carried out to investigate whether the users of East Coast Expressway are…
A: We need to construct the 93% confidence interval for the difference between population proportions…
Q: A sample of eligible voters was selected to test if more than 60% of votes intend to vote in the…
A: The following information has been provided: Null and Alternative Hypothesis : Null Hypothesis : 60%…
Q: Theorem;-2 o are The values al te yandom sample from binomial population. Ef The varientt x taking…
A:
Q: Find the mean of the sampling distribution of sample means using the given information. Round to one…
A: Here, mean is 44 and standard deviation is 8. Sample number is 49. We will use sampling…
Q: The table (on the right) shows the daily COVID-19 confirmed cases in Toronto region from March 8,…
A: Given information: Week Daily cases 1 50 2 202 3 357 4 459 5 985 6 1506 7 1532 8…
Q: The average wait time to get seated at a popular restaurant in the city on a Friday night is 15…
A: From the provided information, Sample size (n) = 13 Level of significance (α) = 0.05
Q: A driver records in the table her speed at various times during her journey. Time (min.) Speed (mph)…
A: Given that The scatter plot is created as Excel : data : insert : scatterplot The correct plot is…
Q: Assume an infinite population and solve the given Given with random samples of size n selected from…
A: Mean of Sampling distribution : The mean of sampling distribution (μx) is an unbiased estimator of…
Q: A teacher tracked how many minutes each student in his class spent on the unit project and created a…
A: A histogram is given and find the number of students
Q: Please see below. I only have one attempt at this. I really need help with this. Does duct tape…
A: Solution-: Does duct tape work better than cryotherapy for removing warts in children and young…
Q: a.What does each line segment represent? b.Why is there a dot in the middle of each line segment?…
A: a. Each line segment represent 95% confidence interval for p. b. There is a dot in the middle of…
Q: The probability that x is at most 18 is P(x --- ) = P(z ---
A: Here Given Sample Size=n=84 Probablity of success =p=0.18
Q: A suburban hotel derives Its revenue from Its hotel and restaurant operations. The owners are…
A: For the given data Fill all the required blanks
Q: Example 3.6 Assuming that the life of a given subsystem, in the wear-out phase, is normally…
A:
Q: Theorem;- Sample mean is unboise estimate of POpulation mean in poission distribution CS Scanned…
A: In question, We'll prove that sample mean is unbiased estimator of population mean for Poisson…
Q: 1. Was a dependent or independent t-test used to analyze the data? How do you know?
A: Note: According to Bartleby guidelines expert solve only one question and rest can be reposted.
Q: Question 13 The claim is a mean is 212 and you want to prove it is more. Test the hypothesis within…
A: According to the given information in this question Given Test statistic = 0.26 Decision = 1.8
Q: Does duct tape work better than cryotherapy for removing warts in children and young adults? Of 26…
A: For the given data Write the null and alternate hypothesis for this test.
Q: A leading magazine (like Barron's) reported at one time that the average number of weeks an…
A: It is given that the mean is 27 and the standard deviation is 3.9.
Q: Suppose that the number of Facebook friends users have is normally distributed with a mean of 132…
A: Let X be the random variable from Normal distribution with mean (µ) = 128, standard deviation (σ) =…
Q: On a planet far far away from Earth, IQ of the ruling species is normally distributed with a mean of…
A:
Q: You intend to conduct a test of homogeneity for a contingency table with 5 categories in the column…
A:
Q: A time series dataset consists of 100 observations x,x,. X,g0. The following summary statistics have…
A:
Q: The data show the chest size and weight of several bears. Find the regression equation, letting…
A: Given Use a significance level of 0.05.
Q: As a result of investigating 12 patients for postoperative aftereffects, 3 had aftereffects. f there…
A: We have to find "probability that the 13th patient will have aftereffects is" ? Given that after…
Q: In the z distribution the mean will always be
A: Z distribution is standard normal distribution
Step by step
Solved in 2 steps with 1 images
- What is meant by the sample space of an experiment?A local newspaper in a large city wants to assess support for the construction of a highway bypass around the central business district to reduce downtown traffic. They survey a random sample of 1152 residents and find that 543 of them support the bypass. Construct and interpret a 95% confidence interval to estimate the proportion of residents who support construction of the bypass.An environmental science teacher at a high school with a large population of students wanted to estimate the proportion of students at the school who regularly recycle plastic bottles. The teacher selected a random sample of students at the school to survey. Each selected student went into the teacher’s office, one at a time, and was asked to respond yes or no to the following question. Based on the responses, a 95 percent confidence interval for the proportion of all students at the school who would respond yes to the question was calculated as (0.584, 0.816 ). (b) Given the method used by the environmental science teacher to collect the responses, explain how bias might have been introduced and describe how the bias might affect the point estimate of the proportion of all students at the school who would respond yes to the question.
- An environmental science teacher at a high school with a large population of students wanted to estimate the proportion of students at the school who regularly recycle plastic bottles. The teacher selected a random sample of students at the school to survey. Each selected student went into the teacher’s office, one at a time, and was asked to respond yes or no to the following question. Based on the responses, a 95 percent confidence interval for the proportion of all students at the school who would respond yes to the question was calculated as (0.584, 0.816 ). (a) How many students were in the sample selected by the environmental science teacher?An environmental science teacher at a high school with a large population of students wanted to estimate the proportion of students at the school who regularly recycle plastic bottles. The teacher selected a random sample of students at the school to survey. Each selected student went into the teacher’s office, one at a time, and was asked to respond yes or no to the following question. Based on the responses, a 95 percent confidence interval for the proportion of all students at the school who would respond yes to the question was calculated as (0.584, 0.816 ). (c) The statistics teacher at the high school was concerned about the potential bias in the survey. To obtain a potentially less biased estimate of the proportion, the statistics teacher used an alternate method for collecting student responses. A random sample of 300 students was selected, and each student was given the following instructions on how to respond to the question. • In private, flip a fair coin. • If heads, you…A Roper Starch survey asked employees ages 25 to 34 whether they would prefer better health insurance or a raise in salary. Of the 500 employees surveyed, 340 said they would prefer better health insurance. Using this sample information, develop a 98% confidence interval for the true proportion of employees who would prefer better health insurance.
- During a flu vaccine shortage in the United States, less than a majority ofpeople were able to receive the vaccine. The results of a survey given to a random sample of 2,350 vaccine-eligible people indicated that 978 of the 2,350 people had received flu vaccine. a) Construct and interpret a 95 percent confidence interval for the proportion of vaccine-eligible people who had received flu vaccine.A university dean is interested in determining the proportion of students who receive some sort of financial aid. Rather than examine the records for all students, the dean randomly selects 200 students and finds that 125 of them are receiving financial aid. Use a 95% confidence interval to estimate the population proportion of students who receive financial aid.When a recent survey asked subjects whether it should or should not be the government's responsibility to impose strict laws to make industry do less damage to the environment, 1400 of 1496 subjects said yes. Construct the 95% confidence interval. Can you conclude whether or not a majority or minority of the population would answer yes?
- In order to judge the effectiveness of an advertising campaign for a certain brand of pretzel, a company obtained a simple random sample of 95 convenience store receipts the week before the ad campaign began, and found that 28 of them showed a purchase of the pretzels. Another simple random sample of 65 receipts was taken the week after the ad campaign, and 33 of them showed a pretzel purchase. Construct a 98% confidence interval for the difference between the proportions of customers purchasing pretzels before and after the ad campaign. Interpret the results. A marketing manager claims that the proportion of customers who purchased pretzels did not change after the ad campaign. Does the confidence interval contradict this claim?In 2003, an organization surveyed 1,500 adult Americans and asked about a certain war, "Do you believe the United States made the right or wrong decision to use military force?" Of the 1,500 adult Americans surveyed, 1,085 stated the United States made the right decision. In 2008, the organization asked the same question of 1,500 adult Americans and found that 570 believed the United States made the right decision. Construct and interpret a 90% confidence interval for the difference between the two population proportions, p2003−p2008.In response to a recent GSS survey on whether the Governmentshould impose strict laws to prohibit industries from damaging the environment, 1093 out of1232 subjects said "yes."The 95% confidence interval for p, the population proportion who would say "yes" is