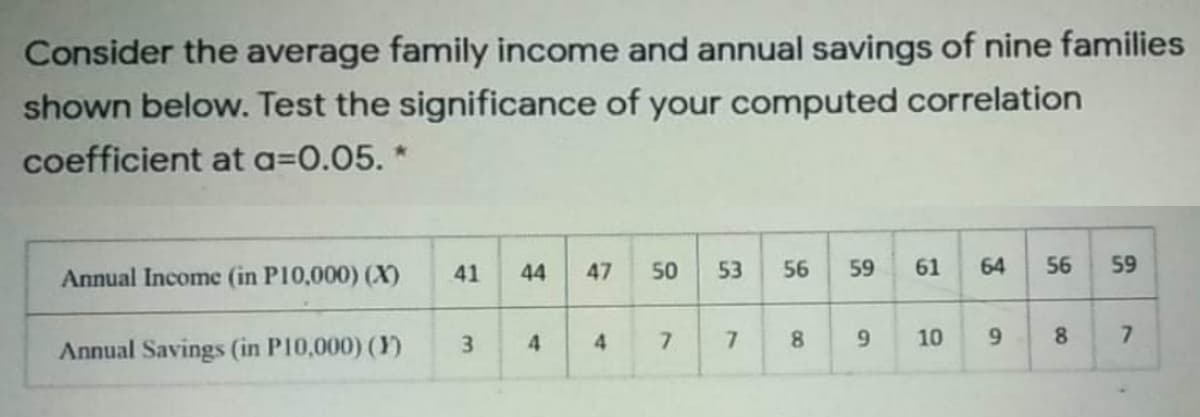
Consider the average family income and annual savings of nine families shown below. Test the significance of your computed correlation coefficient at a=0.05. * Annual Income (in P10,000) (X) 41 44 47 50 53 56 59 61 64 56 59 Annual Savings (in P10,000) () 3. 4 7. 8. 6. 10 8. 9, 4)


Q: For a data set of chest sizes (distance around chest ininches) and weights (pounds) of ten…
A:
Q: Listed below are the overhead widths (in cm) of seals measured from photographs and the weights…
A: Given: Width Weight 7.1 114 7.5 155 9.8 249 9.3 197 8.8 200 8.1 182
Q: The average remaining lifetimes for men of various ages in a certain country are given in the…
A: x (Age) y (Remaining Years) 0 74 15 60.4 35 42.8 65 16.6 75 10.1
Q: The following table shows the number of hours spent for studying and the grade obtained by a student…
A: X Y X.Y X2 Y2 1.5 85 127.5 2.25 7225 2 85 170 4 7225 4 95 380 16 9025 2 87 174 4 7569…
Q: Annual high temperatures in a certain location have been tracked for several years. Let XX represent…
A: x y x2 y2 xy 5 18 25 324 90 6 19.3 36 372.49 115.8 7 17.7 49…
Q: Listed below are the overhead widths (in cm) of seals measured from photographs and the weights (in…
A:
Q: Listed below are the overhead widths (in cm) of seals measured from photographs and the weights (in…
A: Use EXCEL to obtain the value correlation coefficient r: EXCEL procedure: Go to EXCEL Go to…
Q: Listed below are the overhead widths (in cm) of seals measured from photographs and the weights (in…
A: Hello! As you have posted more than 3 sub parts, we are answering the first 3 sub-parts. In case…
Q: calculate the probable error. Calculate Karl Pearson's coefficient of correlation from the following…
A:
Q: The weight (in pounds) and height (in inches) for a child were measured every few months over a…
A:
Q: b) Compute the Correlation Coefficient for your line from (a). c) Using your answer to (b), Is there…
A: 2) a) The slope is, b=n∑xy-∑x∑yn∑x2-∑x2=5×33974-409×4135×33643-4092=953934=1.020343≈1.0203 The…
Q: The accompanying data show the South African population versus expenditure on new construction works…
A: Following table can be constructed as: x y xi-x¯ yi-y¯ xi-x¯yi-y¯ xi-x¯2 yi-y¯2 44.15 17.4…
Q: The following table shows the approximate number of wireless telephone subscriptions in a certain…
A: We have to calculate correlation coefficient between two variables .
Q: Listed below are the overhead widths (in cm) of seals measured from photographs and the weights (in…
A: Solution
Q: The average remaining lifetimes for men of various ages in a certain country are given in the…
A:
Q: A)A set of n=12 of X and Y values produces a Pearson correlation of r= -0.70.Is this a positive of…
A: Given: The sample size is n=12. The correlation coefficient is r= -0.70.
Q: The following table shows the approximate number of wireless telephone subscriptions in a certain…
A: (a) Let x=1 represents the year 2005, tabulate values of x for the given years as follows. x 1 2…
Q: The accompanying table shows the height (in inches) of 8 high school girls and their scores on an…
A: Data given X Y 59 10167 10769 11358 9862 10968 12054 127 Farmula used
Q: Listed below are the overhead widths (in cm) of seals measured from photographs and the weights (in…
A: Consider that overhead width is x and weight is y.
Q: The average remaining lifetimes for men of various ages in a certain country are given in the…
A:
Q: a. What is the value of the correlation coefficient?
A: Here use formula for correlation coefficient Take x = midterm score y = final scores
Q: The correlation coefficient, rr, is a number between 0 and 1 -10 and 10 −∞-∞ and ∞∞ 0 and 100 0…
A: Solution: Correlation: Two variables are said to be correlated if there is a linear association…
Q: Determine if there is correlation between the daily allowance of students and their mean grade in…
A: Given allowance in Peos(X) average grade(Y) 120 88 150 90 100 85 120 87 80 92 100 85…
Q: There has GOT to be an easier way or something I can plug this into a calculator or an excel…
A:
Q: Listed below are the overhead widths (in cm) of seals measured from photographs and the weights (in…
A:
Q: Listed below are the overhead widths (in cm) of seals measured from photographs and the weights (in…
A: Step-by-step procedure to draw scatter plot using Excel: In Excel sheet, enter Width and Weight in…
Q: Listed below are the overhead widths (in cm) of seals measured from photographs and the weights (in…
A: Solution
Q: The average remaining lifetimes for men of various ages in a certain country are given in the…
A:
Q: What information is provided by r (the correlation coefficient)?
A: Note: Thank you for the question. Since multiple questions are posted, according to our policy, we…
Q: isted below are the overhead widths (in cm) of seals measured from photographs and the weights (in…
A: The Scatter diagram measures the relationship between two variable. On X-axis it represents the…
Q: The weight (in pounds) and height (in inches) for a child Using technology, what is the correlation…
A: Solution: x y x^2 y^2 x⋅y 8 22 64 484 176 12 23 144 529 276 18 26 324 676 468 24 30 576…
Q: The data obtained in a study on the number of absences in virtual class and the final grades of…
A:
Q: Listed below are the overhead widths (in cm) of seals measured from photographs and the weights…
A: Scatterplot: Step by step procedure in EXCEL: Step-1: Select the…
Q: The maximum weights (in kilograms) for which one repetition of a half-squat can be performed and…
A: Consider that ρ is the population correlation coefficient and r is the sample correlation…
Q: 9. Compute the correlation coefficient, r, from the given table of data using a graphing calculator…
A: We haver= ∑i=1n(xi-x¯)(yi-y¯)∑i=1n(xi-x¯)2∑i=1n(yi-y¯)2n = 10 x¯ = -4-3-2-1+1+2+3+4+5+610=1.1y¯ =…
Q: The weight (in pounds) and height (in inches) for a child were measured every few months over a…
A: Correlation coefficient quantifies the strength and direction of relationship between variable. The…
Q: (b) Compute the correlation coefficient between systolic and diastolic blood pressure. Round your…
A: Here use Pearson correlation coefficient formula
Q: Listed below are the overhead widths (in cm) of seals measured from photographs and the weights (in…
A: We have given that, X :- 7.2, 7.6, 9.8, 9.2, 8.8 , 8.3 Y:- 115, 176, 249,…
Q: Listed below are the overhead widths (in cm) of seals measured from photographs and the weights (in…
A: a) overhead width weight 7 107.00 7.7 174.00 9.8 248.00 9.2 196.00 8.8 202.00 8.3…
Q: Listed below are the overhead widths (in cm) of seals measured from photographs and the weights (in…
A: From given data, X Y X*Y X*X Y*Y 7.1 114 809.4 50.41 12996 7.6 180 1368 57.76 32400 9.8 248…
Q: A past STAT 200 student tells you that there is a very strong positive linear association between…
A: we know that correlation coefficient(r) alwayslies between -1 and +1 (including -1 and +1)i.e…
Q: The following table shows the magnitude of earthquakes on the Richter scale, x, and the…
A: Calculate the following values. x y (x - mean_x)2 (y - mean_y)2 (x - mean_x)*(y - mean_y) 2.9…
Q: Listed below are the overhead widths (in cm) of seals measured from photographs and the weights (in…
A: The scatter plot is obtained using EXCEL. The software procedure is given below: Enter the data.…
Q: Which of Pearson's r values below indicates the strongest correlation? notice the negative signs and…
A: The correlation value is always between -1 and 1.
Q: The following table shows the hours studied and corresponding test grade earned by students on a…
A: Use EXCEL to obtain the value correlation coefficient r: EXCEL procedure: Go to EXCEL Go to…
Q: The following table shows the selling prices, in thousands of dollars, and the square footages of…
A: The null and alternative hypotheses are stated below:Null hypothesis: There is no significant…
Q: What does it mean if the linear correlation coefficient is A) 0? B) -1?
A: A) It is given that the correlation coefficient is 0.
Q: The data obtained in a study on the number of absences in virtual class and the final grades of…
A: Given: n=7 x y 6 82 2 86 15 43 9 74 2 58 5 90 8 78
Q: The blood pressure measurements of a single patient were taken by twelve different medical students…
A: As per our guidelines, we are allowed to answer first three sub-parts only. Thanks The following…
Q: 014 44.15 17.4 2015 44.72 21.19 2016 45.26 22.3 2017 44.58 18.92
A: Following table can be constructed as:

Step by step
Solved in 2 steps

- A survey of 28 employed workers found that the correlation coefficient between the number of years of post-secondary education and current annual income in dollars is -0.38. The researchers hypothesize a positive relationship between number of years of post-secondary education and annual income. What can the researchers conclude with α = 0.05? a) Obtain/compute the appropriate values to make a decision about H0. critical value= test statistic= b) effect size= C) 1)There is a significant positive relationship between years of post-secondary education and current annual income. 2)There is a significant negative relationship between years of post-secondary education and current annual income. 3) There is no significant relationship between years of post-secondary education and current annual income.As we have noted in previous chapters, even a very small effect can be significant if the sample is large enough. Suppose, for example, that a researcher obtains a correlation (computed from the raw data) of r = 0.60 for a sample of n = 10 participants. (4 pts. total) Is this sample sufficient to conclude that a significant correlation exists in the population? Use a two-tailed test with α = .05. In your response, be sure to specify the critical value for r.Compute the F statistic and test the significance of the relationship at a 0.05 level of significance
- Compute the value of the correlation coefficient. Round answer to at least three decimal places.Even a very small effect can be significant if the sample is large enough. Suppose, for example, that a researcher obtains a correlation (computed from the raw data) of r = 0.60 for a sample of n = 10 participants. a. Is this sample sufficient to conclude that a significant correlation exists in the population? Use a two-tailed test with α = .05. In your response, be sure to specify the critical value for r. b. If the sample had n = 25 participants, is the correlation significant? Again, use a two-tailed test with α = .05. In your response, be sure to specify the critical value for r.Even a very small effect can be significant if the sample is large enough. Suppose, for example, that a researcher obtains a correlation (computed from the raw data) of r = 0.60 for a sample of n = 10 participants. a. Is this sample sufficient to conclude that a significant correlation exists in the population? Use a two-tailed test with α = .05. In your response, be sure to specify the critical value for r. please don't use excel to find the P - value. b. If the sample had n = 25 participants, is the correlation significant? Again, use a two-tailed test with α = .05. In your response, be sure to specify the critical value for r. show all work. please don't use excel to find the P - value.
- A study was done to compare the flu incidence rates at the sart and at the end of winter of a given year. A sample of 100 persons were asked for incidence of flu twice: once at the start and once at the end of winter. Sample data were as follows: a. Give 99% CI for the difference in flu incidence rates at the start and at the end of winter? b. Compute a measure of association between flue incidence at the start and at the end of winter?8 The correlation between monthly sales and advertisement cost for a product in 24 sales centers was found to be 0.45. Find the p-value for testing the direct relationship between these two quantities.The Pearson's correlation coefficient (r) between height and weight of 100 individuals is calculated to be 0.75. At a significance level of 0.05, test the hypothesis that the population correlation coefficient is different from 0.
- Data from a recent year showed that 55% of the tens of thousands of applicants to a certain program were accepted. A company that trains applicants claimed that 135 of the 240 students, it trained that year were accepted. Assume these trainees were representative of the population of applicants. Has the company demonstrated a real improvement over the average? What is the P-value?If I'm trying to find the correlation between A and B using a statistical test, should I consider the distribution of A or distribution of B or distribution of both while selecting a statistical test? My A has numerical discrete data that ranges from 0 to 99 My B is a binomial/ dichotomous data with values 0s and 1s. A - number of times people eat fast food in 30 days - range 0 to 99 - numerical discrete data - positively skewed. B - Obese or not - 0 or 1 - binomial data - normally distributed Please help! I have a submission!. In estimating a regression based on monthly observations from January 1987 to December 2002 inclusive, you find that the coefficient on the independent variable is positive and significant at the 0.05 level. you are concerned, however, that the t-statistic on the independent variable may be inflated because of serial correlation between the error terms. Therefore, you examine the Durbin–Watson statistic, which is 1.8953 for this regression. Based on the value of the Durbin Watson statistic, what can you say about the serial correlation between the regression residuals? are they positively correlated, negatively correlated, or not correlated at all? Compute the sample correlation between the regression residuals from one period and those from the previous period. Perform a statistical test to determine if serial correlation is present. assume that the critical values for 192 observations when there is a single independent variable are about 0.09 above the critical values for 100…