isted below are the overhead widths (in cm) of seals measured from photographs and the weights (in kg) of the seals. Construct a scatterplot, find the value of the linear correlation coefficient r, and find the critical values of r using a= 0.05. Is there sufficient vidence to conclude that there is a linear correlation between overhead widths of seals from photographs and the weights of the seals? Overhead Width 7.1 7.6 9.8 9.2 8.7 8.2 먼 Weight 112 170 247 196 201 186 Click here to view a table of critical values for the correlation coefficient Construct a scatterplot. Choose the correct graph below. D A. O D. Aweight (kg) 300- OB. Aweight (kg) 300- OC. Aweight (kg) 300- Aweight (kg) 300- 100+ 100 100 100+ 10 width (cm) 10 10 10 width (cm) width (cm) width (cm) Table of Critical Values a = .05 .950 .990 .878 .959 6. .811 .917 lick to select your answer and then click Check Answer. 7. .754 .875 456 7
isted below are the overhead widths (in cm) of seals measured from photographs and the weights (in kg) of the seals. Construct a scatterplot, find the value of the linear correlation coefficient r, and find the critical values of r using a= 0.05. Is there sufficient vidence to conclude that there is a linear correlation between overhead widths of seals from photographs and the weights of the seals? Overhead Width 7.1 7.6 9.8 9.2 8.7 8.2 먼 Weight 112 170 247 196 201 186 Click here to view a table of critical values for the correlation coefficient Construct a scatterplot. Choose the correct graph below. D A. O D. Aweight (kg) 300- OB. Aweight (kg) 300- OC. Aweight (kg) 300- Aweight (kg) 300- 100+ 100 100 100+ 10 width (cm) 10 10 10 width (cm) width (cm) width (cm) Table of Critical Values a = .05 .950 .990 .878 .959 6. .811 .917 lick to select your answer and then click Check Answer. 7. .754 .875 456 7

Chapter4: Linear Functions
Section: Chapter Questions
Problem 30PT: For the following exercises, use Table 4 which shows the percent of unemployed persons 25 years or...

Related questions
Question
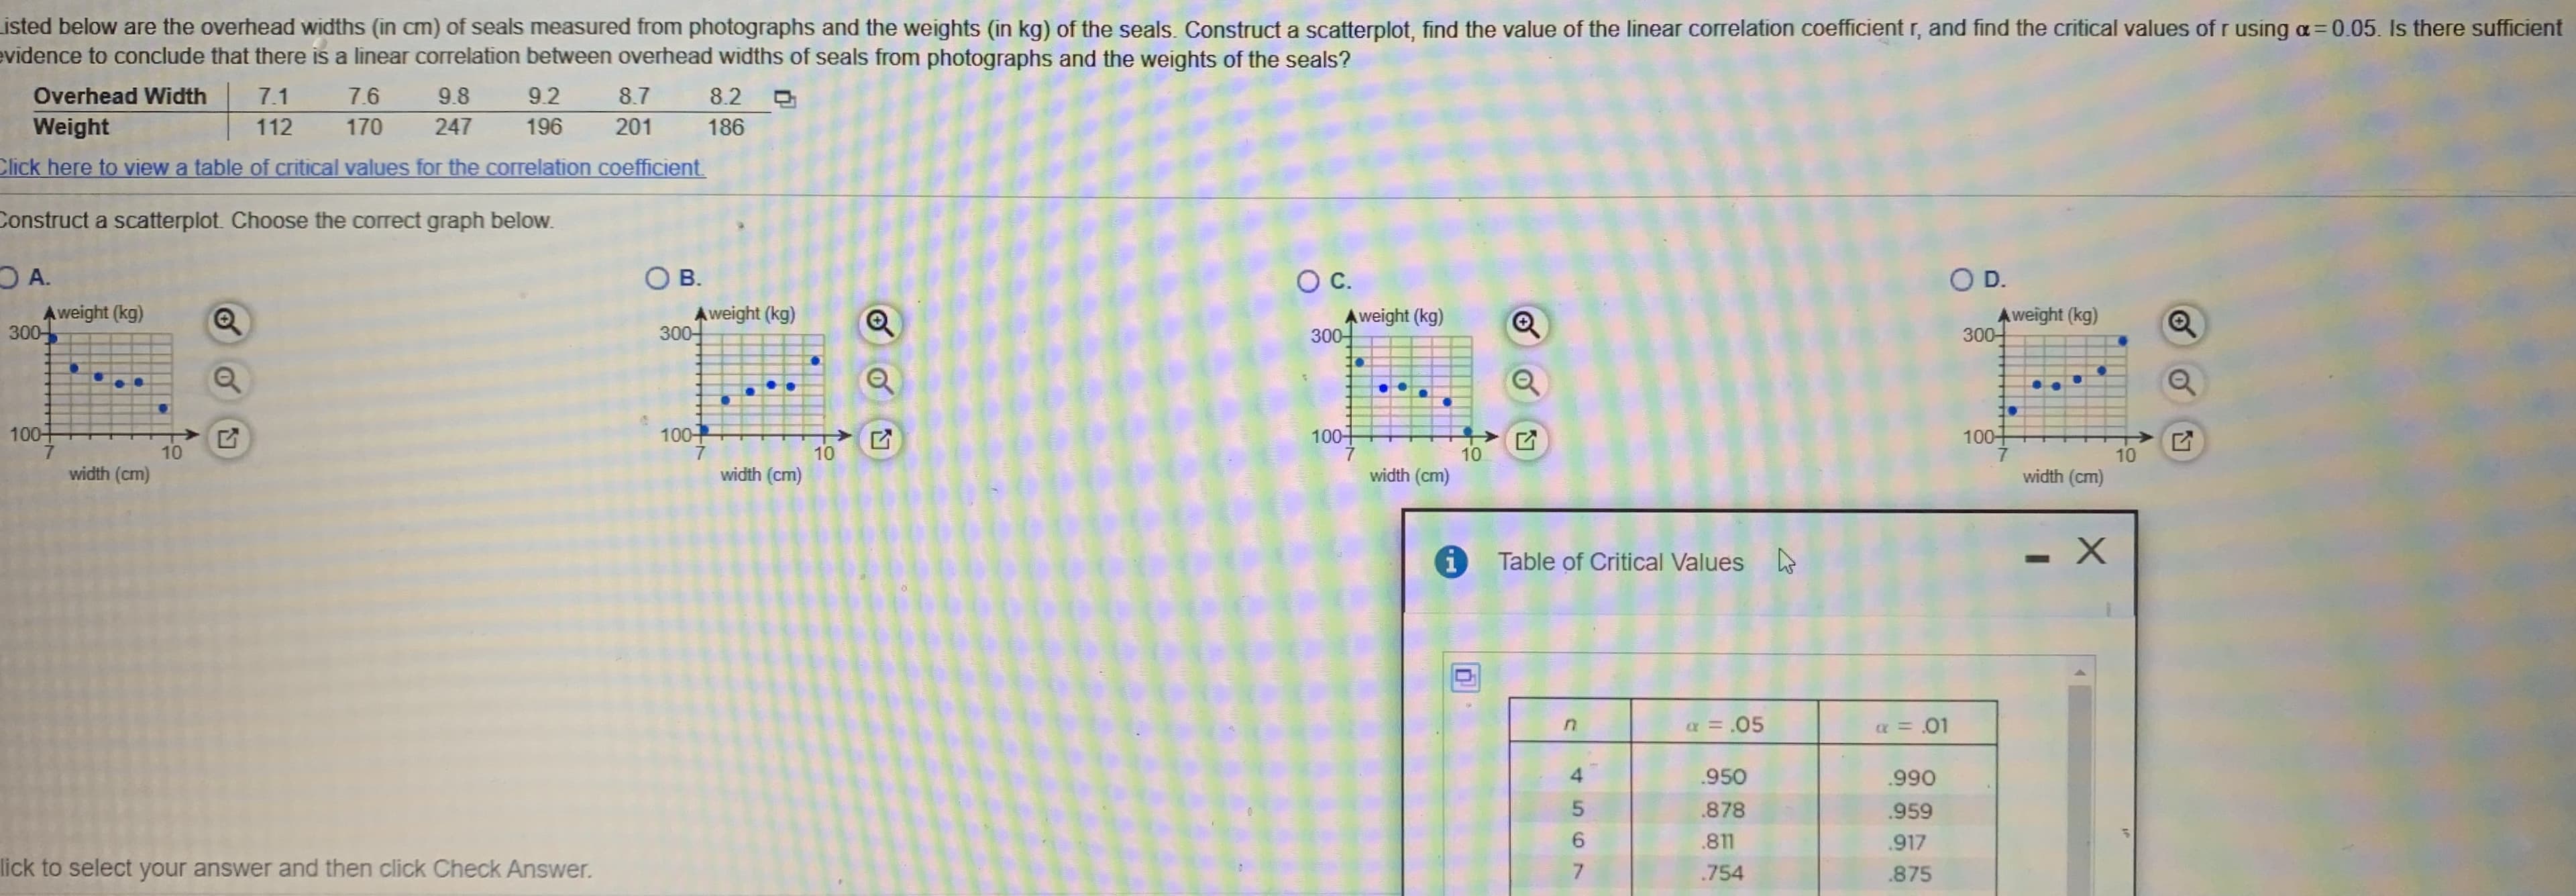
Transcribed Image Text:isted below are the overhead widths (in cm) of seals measured from photographs and the weights (in kg) of the seals. Construct a scatterplot, find the value of the linear correlation coefficient r, and find the critical values of r using a= 0.05. Is there sufficient
vidence to conclude that there is a linear correlation between overhead widths of seals from photographs and the weights of the seals?
Overhead Width
7.1
7.6
9.8
9.2
8.7
8.2 먼
Weight
112
170
247
196
201
186
Click here to view a table of critical values for the correlation coefficient
Construct a scatterplot. Choose the correct graph below.
D A.
O D.
Aweight (kg)
300-
OB.
Aweight (kg)
300-
OC.
Aweight (kg)
300-
Aweight (kg)
300-
100+
100
100
100+
10
width (cm)
10
10
10
width (cm)
width (cm)
width (cm)
Table of Critical Values
a = .05
.950
.990
.878
.959
6.
.811
.917
lick to select your answer and then click Check Answer.
7.
.754
.875
456 7
Expert Solution
This question has been solved!
Explore an expertly crafted, step-by-step solution for a thorough understanding of key concepts.

This is a popular solution!

Trending now
This is a popular solution!

Step by step
Solved in 2 steps with 1 images

Recommended textbooks for you

Glencoe Algebra 1, Student Edition, 9780079039897…
Algebra
ISBN:
9780079039897
Author:
Carter
Publisher:
McGraw Hill
Glencoe Algebra 1, Student Edition, 9780079039897…
Algebra
ISBN:
9780079039897
Author:
Carter
Publisher:
McGraw Hill