Consider the boxplot below. 18 36 50 61 10 60 70 30 20 data 40 50 a. What quarter has the largest spread of data? O First Quarter O Second Quarter O Fourth Quarter O Third Quarter b. What is that spread? c. Find the Inter Quartile Range (1QR): d. Which interval has the most data in it? O5 - 18 O 49 - 61 O 18 - 36 O 39 - 50 e. What value could represent the 55th percentile? O 13 20 O 51 O 39
Consider the boxplot below. 18 36 50 61 10 60 70 30 20 data 40 50 a. What quarter has the largest spread of data? O First Quarter O Second Quarter O Fourth Quarter O Third Quarter b. What is that spread? c. Find the Inter Quartile Range (1QR): d. Which interval has the most data in it? O5 - 18 O 49 - 61 O 18 - 36 O 39 - 50 e. What value could represent the 55th percentile? O 13 20 O 51 O 39

Glencoe Algebra 1, Student Edition, 9780079039897, 0079039898, 2018
18th Edition
ISBN:9780079039897
Author:Carter
Publisher:Carter
Chapter10: Statistics
Section10.5: Comparing Sets Of Data
Problem 14PPS

Related questions
Question
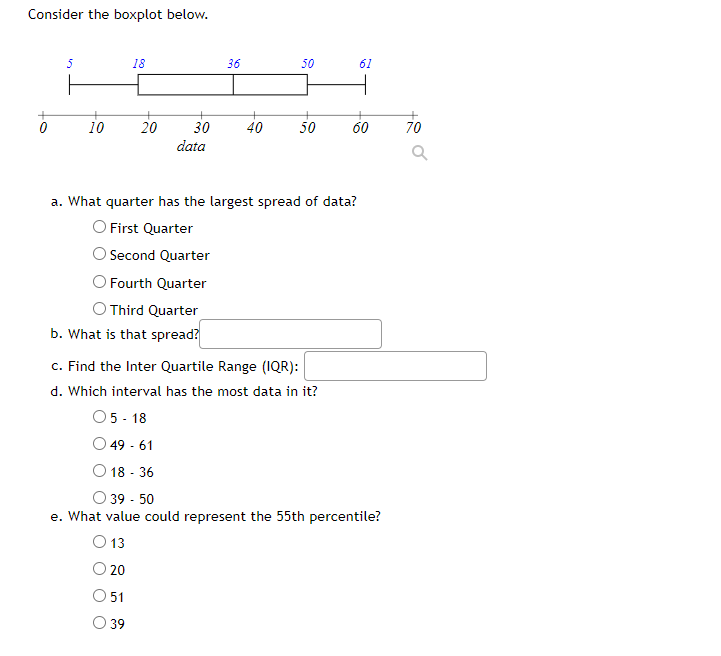
Transcribed Image Text:Consider the boxplot below.
5
18
36
50
61
10
20
30
40
50
60
70
data
a. What quarter has the largest spread of data?
O First Quarter
Second Quarter
Fourth Quarter
O Third Quarter
b. What is that spread?
c. Find the Inter Quartile Range (IQR):
d. Which interval has the most data in it?
05 - 18
49 - 61
18 - 36
O 39 - 50
e. What value could represent the 55th percentile?
O 13
20
O 51
39
Expert Solution
This question has been solved!
Explore an expertly crafted, step-by-step solution for a thorough understanding of key concepts.

This is a popular solution!

Trending now
This is a popular solution!

Step by step
Solved in 4 steps with 1 images

Recommended textbooks for you
Glencoe Algebra 1, Student Edition, 9780079039897…
Algebra
ISBN:
9780079039897
Author:
Carter
Publisher:
McGraw Hill

Mathematics For Machine Technology
Advanced Math
ISBN:
9781337798310
Author:
Peterson, John.
Publisher:
Cengage Learning,
Glencoe Algebra 1, Student Edition, 9780079039897…
Algebra
ISBN:
9780079039897
Author:
Carter
Publisher:
McGraw Hill
Mathematics For Machine Technology
Advanced Math
ISBN:
9781337798310
Author:
Peterson, John.
Publisher:
Cengage Learning,