Refer to the incomplete grouped frequency distribution below. Classes (Rand) Frequency Cumulative frequency 24 8.00 < 12.00 24 12.00 < 16.00 X 16.00 < 20.00 Y 46 20.00 < 24.00 102 120 18 120 ТOTALS The value of Efm is
Refer to the incomplete grouped frequency distribution below. Classes (Rand) Frequency Cumulative frequency 24 8.00 < 12.00 24 12.00 < 16.00 X 16.00 < 20.00 Y 46 20.00 < 24.00 102 120 18 120 ТOTALS The value of Efm is

Glencoe Algebra 1, Student Edition, 9780079039897, 0079039898, 2018
18th Edition
ISBN:9780079039897
Author:Carter
Publisher:Carter
Chapter10: Statistics
Section: Chapter Questions
Problem 23SGR

Related questions
Question
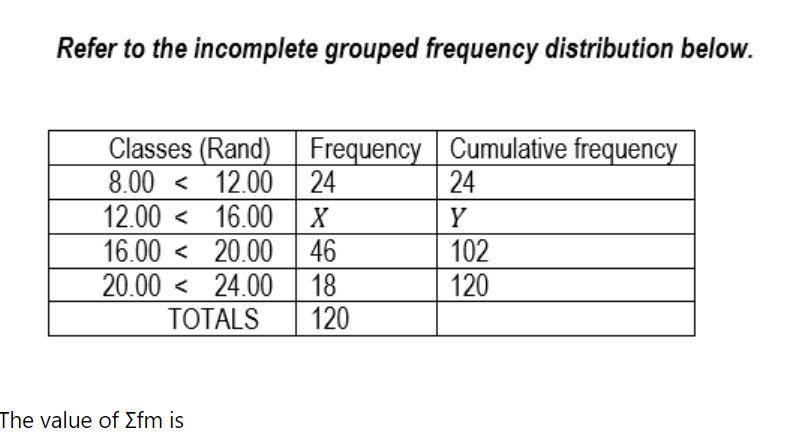
Transcribed Image Text:Refer to the incomplete grouped frequency distribution below.
Classes (Rand) Frequency Cumulative frequency
24
24
8.00 < 12.00
12.00 < 16.00
X
Y
16.00 < 20.00 | 46
102
20.00 < 24.00
18
120
ТOTALS
120
The value of Efm is
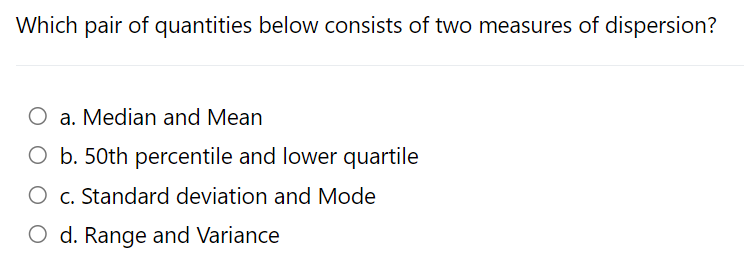
Transcribed Image Text:Which pair of quantities below consists of two measures of dispersion?
O a. Median and Mean
O b. 50th percentile and lower quartile
O c. Standard deviation and Mode
O d. Range and Variance
Expert Solution
This question has been solved!
Explore an expertly crafted, step-by-step solution for a thorough understanding of key concepts.

Step by step
Solved in 3 steps with 3 images

Recommended textbooks for you
Glencoe Algebra 1, Student Edition, 9780079039897…
Algebra
ISBN:
9780079039897
Author:
Carter
Publisher:
McGraw Hill
Glencoe Algebra 1, Student Edition, 9780079039897…
Algebra
ISBN:
9780079039897
Author:
Carter
Publisher:
McGraw Hill