Consider the Excel template for the two-asset efficient frontier as provided in the announcement for the quiz. Set the mean return for the SP500 to be 10% with 20% standard deviation (green box) Set the mean return for the TBond to be 5% with 10% standard deviation (green box) Set the correlation between the SP500 and the TBond to be 10% (green box) Set the target portfolio return to be 10% in expectation (yellow box) Find the minimum standard deviation using Excel's solver (blue box). What is it? O About 14.48% O About 20.77% O About 18.37% O About 13.45%
Consider the Excel template for the two-asset efficient frontier as provided in the announcement for the quiz. Set the mean return for the SP500 to be 10% with 20% standard deviation (green box) Set the mean return for the TBond to be 5% with 10% standard deviation (green box) Set the correlation between the SP500 and the TBond to be 10% (green box) Set the target portfolio return to be 10% in expectation (yellow box) Find the minimum standard deviation using Excel's solver (blue box). What is it? O About 14.48% O About 20.77% O About 18.37% O About 13.45%

Chapter8: Analysis Of Risk And Return
Section: Chapter Questions
Problem 18P

Related questions
Question
100%
2
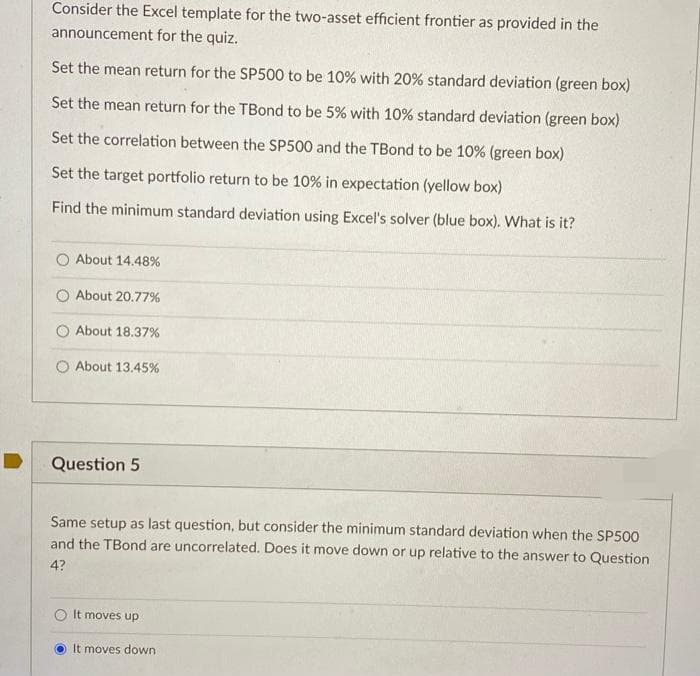
Transcribed Image Text:Consider the Excel template for the two-asset efficient frontier as provided in the
announcement for the quiz.
Set the mean return for the SP500 to be 10% with 20% standard deviation (green box)
Set the mean return for the TBond to be 5% with 10% standard deviation (green box)
Set the correlation between the SP500 and the TBond to be 10% (green box)
Set the target portfolio return to be 10% in expectation (yellow box)
Find the minimum standard deviation using Excel's solver (blue box). What is it?
O About 14.48%
About 20.77%
O About 18.37%
O About 13.45%
Question 5
Same setup as last question, but consider the minimum standard deviation when the SP500
and the TBond are uncorrelated. Does it move down or up relative to the answer to Question
4?
It moves up
It moves down
Expert Solution
This question has been solved!
Explore an expertly crafted, step-by-step solution for a thorough understanding of key concepts.

This is a popular solution!

Trending now
This is a popular solution!

Step by step
Solved in 4 steps with 4 images

Recommended textbooks for you
EBK CONTEMPORARY FINANCIAL MANAGEMENT
Finance
ISBN:
9781337514835
Author:
MOYER
Publisher:
CENGAGE LEARNING - CONSIGNMENT

Essentials of Business Analytics (MindTap Course …
Statistics
ISBN:
9781305627734
Author:
Jeffrey D. Camm, James J. Cochran, Michael J. Fry, Jeffrey W. Ohlmann, David R. Anderson
Publisher:
Cengage Learning
EBK CONTEMPORARY FINANCIAL MANAGEMENT
Finance
ISBN:
9781337514835
Author:
MOYER
Publisher:
CENGAGE LEARNING - CONSIGNMENT
Essentials of Business Analytics (MindTap Course …
Statistics
ISBN:
9781305627734
Author:
Jeffrey D. Camm, James J. Cochran, Michael J. Fry, Jeffrey W. Ohlmann, David R. Anderson
Publisher:
Cengage Learning