Consider the figures below. Taken together, do the figures support arguments regarding poverty, mobility or job polarization? Explain the argument. Explain why each figure is consistent with one of these economic concepts. Be sure to connect the details in the figure with the definition of the concept.
Consider the figures below. Taken together, do the figures support arguments regarding poverty, mobility or job polarization? Explain the argument. Explain why each figure is consistent with one of these economic concepts. Be sure to connect the details in the figure with the definition of the concept.

Chapter1: Making Economics Decisions
Section: Chapter Questions
Problem 1QTC

Related questions
Question
Consider the figures below. Taken together, do the figures support arguments regarding poverty, mobility or job polarization? Explain the argument. Explain why each figure is consistent with one of these economic concepts. Be sure to connect the details in the figure with the definition of the concept.
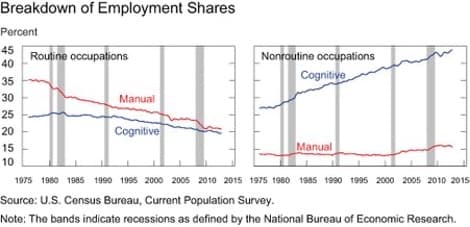
Transcribed Image Text:Breakdown of Employment Shares
Percent
45
Routine occupations
Nonroutine occupations
40
Cognitive
35
30
Manual
25
20
Cognitive
15
Manual
10
1975 1980 1985 1990 1995 2000 2005 2010 2015 1975 1980 1985 1990 1995 2000 2005 2010 2015
Source: U.S. Census Bureau, Current Population Survey.
Note: The bands indicate recessions as defined by the National Bureau of Economic Research.
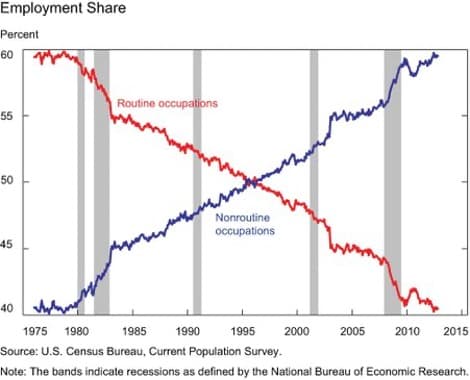
Transcribed Image Text:Employment Share
Percent
60
Routine occupations
55
50
Nonroutine
occupations
45
40
1975 1980
1985
1990
1995
2000
2005
2010
2015
Source: U.S. Census Bureau, Current Population Survey.
Note: The bands indicate recessions as defined by the National Bureau of Economic Research.
Expert Solution
This question has been solved!
Explore an expertly crafted, step-by-step solution for a thorough understanding of key concepts.

Step by step
Solved in 2 steps

Knowledge Booster


Learn more about
Need a deep-dive on the concept behind this application? Look no further. Learn more about this topic, economics and related others by exploring similar questions and additional content below.Recommended textbooks for you

Principles of Economics (12th Edition)
Economics
ISBN:
9780134078779
Author:
Karl E. Case, Ray C. Fair, Sharon E. Oster
Publisher:
PEARSON

Engineering Economy (17th Edition)
Economics
ISBN:
9780134870069
Author:
William G. Sullivan, Elin M. Wicks, C. Patrick Koelling
Publisher:
PEARSON
Principles of Economics (12th Edition)
Economics
ISBN:
9780134078779
Author:
Karl E. Case, Ray C. Fair, Sharon E. Oster
Publisher:
PEARSON
Engineering Economy (17th Edition)
Economics
ISBN:
9780134870069
Author:
William G. Sullivan, Elin M. Wicks, C. Patrick Koelling
Publisher:
PEARSON

Principles of Economics (MindTap Course List)
Economics
ISBN:
9781305585126
Author:
N. Gregory Mankiw
Publisher:
Cengage Learning

Managerial Economics: A Problem Solving Approach
Economics
ISBN:
9781337106665
Author:
Luke M. Froeb, Brian T. McCann, Michael R. Ward, Mike Shor
Publisher:
Cengage Learning

Managerial Economics & Business Strategy (Mcgraw-…
Economics
ISBN:
9781259290619
Author:
Michael Baye, Jeff Prince
Publisher:
McGraw-Hill Education