The folloving graph shovs the daily market for wine vwhen a tax on sellers is set at $0 per bottle. Suppose the government institutes a tax of $5.80 per bottle, to be paid by the seller. (Hint: To see the impact of the tax, enter the value of the tax in the Tax on Sellers field and move the green line to the after-tax equilibrium by adjusting the value in the Quantity field. Then enter zero in the Tax on Sellers field. You should see a tax vedge betveen the price buyers pay and the price sellers receive.) Use the graph input tool to help you answer the following questions. You will not be graded on any changes you make to this graph. Note: Once you enter a value in a white field, the graph and any corresponding amounts in each grey field will change accordingly. Graph Input Tool Market for Wine 50 I Quantity (Bottles of wine) 50 45 Demand Price (Dollars per bottle) Supply Price (Dollars per bottle) 40 75.00 17.00 Supply 35 Supply Shifter 30 25 Tax on Sellers (Dollars per bottle) 0.00 20 15 Demand 10 O s0 100 150 200 250 300 350 400 450 s00 QUANTITY (Bottles of wine) Fill in the following table with the quantity sold, the price buyers pay, and the price sellers receive before and after the tax. Quantity Price Buyers Pay Price Sellers Receive (Bottles of wine) (Dollars per bottle) (Dollars per bottle) Before Tax After Tax Using the data from the previous table, the tax burden that falls on buyers is s and the tax burden of sellers is s PRICE (Doll ars per bottle)
The folloving graph shovs the daily market for wine vwhen a tax on sellers is set at $0 per bottle. Suppose the government institutes a tax of $5.80 per bottle, to be paid by the seller. (Hint: To see the impact of the tax, enter the value of the tax in the Tax on Sellers field and move the green line to the after-tax equilibrium by adjusting the value in the Quantity field. Then enter zero in the Tax on Sellers field. You should see a tax vedge betveen the price buyers pay and the price sellers receive.) Use the graph input tool to help you answer the following questions. You will not be graded on any changes you make to this graph. Note: Once you enter a value in a white field, the graph and any corresponding amounts in each grey field will change accordingly. Graph Input Tool Market for Wine 50 I Quantity (Bottles of wine) 50 45 Demand Price (Dollars per bottle) Supply Price (Dollars per bottle) 40 75.00 17.00 Supply 35 Supply Shifter 30 25 Tax on Sellers (Dollars per bottle) 0.00 20 15 Demand 10 O s0 100 150 200 250 300 350 400 450 s00 QUANTITY (Bottles of wine) Fill in the following table with the quantity sold, the price buyers pay, and the price sellers receive before and after the tax. Quantity Price Buyers Pay Price Sellers Receive (Bottles of wine) (Dollars per bottle) (Dollars per bottle) Before Tax After Tax Using the data from the previous table, the tax burden that falls on buyers is s and the tax burden of sellers is s PRICE (Doll ars per bottle)

Essentials of Economics (MindTap Course List)
8th Edition
ISBN:9781337091992
Author:N. Gregory Mankiw
Publisher:N. Gregory Mankiw
Chapter6: Supply, Demand And Government Policies
Section: Chapter Questions
Problem 2PA

Related questions
Question
this question has not been graded i am trying to get help with it. it is a macroeconmics question
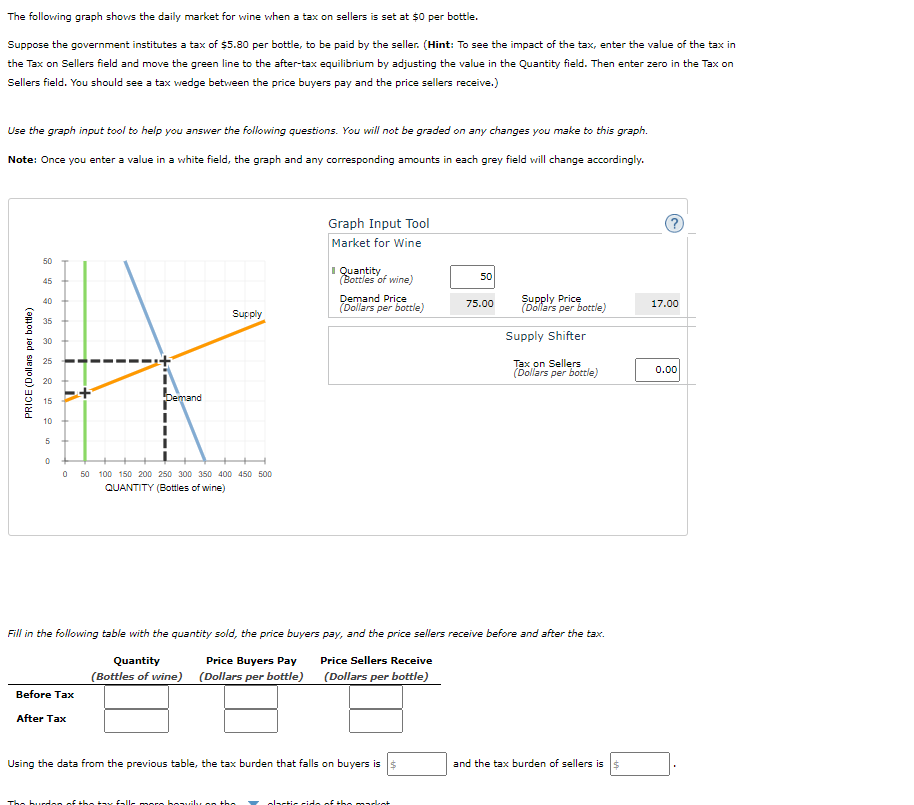
Transcribed Image Text:The folloving graph shovs the daily market for wine vwhen a tax on sellers is set at $0 per bottle.
Suppose the government institutes a tax of $5.80 per bottle, to be paid by the seller. (Hint: To see the impact of the tax, enter the value of the tax in
the Tax on Sellers field and move the green line to the after-tax equilibrium by adjusting the value in the Quantity field. Then enter zero in the Tax on
Sellers field. You should see a tax vedge betveen the price buyers pay and the price sellers receive.)
Use the graph input tool to help you answer the following questions. You will not be graded on any changes you make to this graph.
Note: Once you enter a value in a white field, the graph and any corresponding amounts in each grey field will change accordingly.
Graph Input Tool
Market for Wine
50
I Quantity
(Bottles of wine)
50
45
Demand Price
(Dollars per bottle)
Supply Price
(Dollars per bottle)
40
75.00
17.00
Supply
35
Supply Shifter
30
25
Tax on Sellers
(Dollars per bottle)
0.00
20
15
Demand
10
O s0 100 150 200 250 300 350 400 450 s00
QUANTITY (Bottles of wine)
Fill in the following table with the quantity sold, the price buyers pay, and the price sellers receive before and after the tax.
Quantity
Price Buyers Pay
Price Sellers Receive
(Bottles of wine) (Dollars per bottle) (Dollars per bottle)
Before Tax
After Tax
Using the data from the previous table, the tax burden that falls on buyers is s
and the tax burden of sellers is s
PRICE (Doll ars per bottle)
Expert Solution
This question has been solved!
Explore an expertly crafted, step-by-step solution for a thorough understanding of key concepts.

This is a popular solution!

Trending now
This is a popular solution!

Step by step
Solved in 2 steps

Knowledge Booster


Learn more about
Need a deep-dive on the concept behind this application? Look no further. Learn more about this topic, economics and related others by exploring similar questions and additional content below.Recommended textbooks for you
Essentials of Economics (MindTap Course List)
Economics
ISBN:
9781337091992
Author:
N. Gregory Mankiw
Publisher:
Cengage Learning

Principles of Microeconomics (MindTap Course List)
Economics
ISBN:
9781305971493
Author:
N. Gregory Mankiw
Publisher:
Cengage Learning

Principles of Macroeconomics (MindTap Course List)
Economics
ISBN:
9781285165912
Author:
N. Gregory Mankiw
Publisher:
Cengage Learning
Essentials of Economics (MindTap Course List)
Economics
ISBN:
9781337091992
Author:
N. Gregory Mankiw
Publisher:
Cengage Learning
Principles of Microeconomics (MindTap Course List)
Economics
ISBN:
9781305971493
Author:
N. Gregory Mankiw
Publisher:
Cengage Learning
Principles of Macroeconomics (MindTap Course List)
Economics
ISBN:
9781285165912
Author:
N. Gregory Mankiw
Publisher:
Cengage Learning

Principles of Economics, 7th Edition (MindTap Cou…
Economics
ISBN:
9781285165875
Author:
N. Gregory Mankiw
Publisher:
Cengage Learning

Principles of Economics (MindTap Course List)
Economics
ISBN:
9781305585126
Author:
N. Gregory Mankiw
Publisher:
Cengage Learning

Principles of Macroeconomics (MindTap Course List)
Economics
ISBN:
9781305971509
Author:
N. Gregory Mankiw
Publisher:
Cengage Learning