Consider the following bivariate linear regression model y = a + Bx + u. Suppose that Cov(x, u) > 0, Cov(z,x) > 0, and Cov(z, u) = 0. Then, plim(BoLs) > B and plim(Brv) > plim(BoLs). %3D O True O False
Consider the following bivariate linear regression model y = a + Bx + u. Suppose that Cov(x, u) > 0, Cov(z,x) > 0, and Cov(z, u) = 0. Then, plim(BoLs) > B and plim(Brv) > plim(BoLs). %3D O True O False

Elementary Linear Algebra (MindTap Course List)
8th Edition
ISBN:9781305658004
Author:Ron Larson
Publisher:Ron Larson
Chapter2: Matrices
Section2.6: More Applications Of Matrix Operations
Problem 31E

Related questions
Question
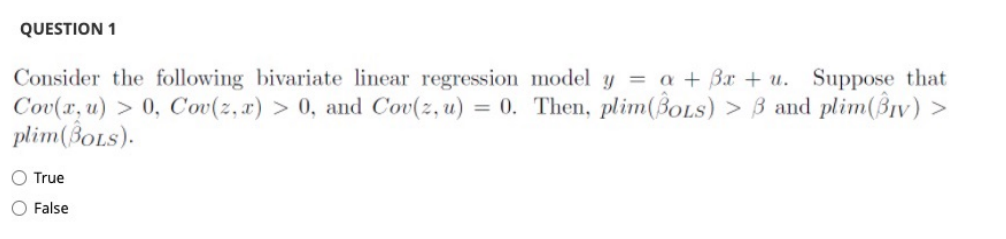
Transcribed Image Text:QUESTION 1
Consider the following bivariate linear regression model y = a + Bx + u. Suppose that
Cov(r, u) > 0, Cov(z,x) > 0, and Cov(z, u) = 0. Then, plim(BOLS) > B and plim(ßıv) >
plim(BoLs).
O True
O False
Expert Solution
This question has been solved!
Explore an expertly crafted, step-by-step solution for a thorough understanding of key concepts.

This is a popular solution!

Trending now
This is a popular solution!

Step by step
Solved in 2 steps with 5 images

Recommended textbooks for you
Elementary Linear Algebra (MindTap Course List)
Algebra
ISBN:
9781305658004
Author:
Ron Larson
Publisher:
Cengage Learning

Functions and Change: A Modeling Approach to Coll…
Algebra
ISBN:
9781337111348
Author:
Bruce Crauder, Benny Evans, Alan Noell
Publisher:
Cengage Learning

College Algebra
Algebra
ISBN:
9781305115545
Author:
James Stewart, Lothar Redlin, Saleem Watson
Publisher:
Cengage Learning
Elementary Linear Algebra (MindTap Course List)
Algebra
ISBN:
9781305658004
Author:
Ron Larson
Publisher:
Cengage Learning
Functions and Change: A Modeling Approach to Coll…
Algebra
ISBN:
9781337111348
Author:
Bruce Crauder, Benny Evans, Alan Noell
Publisher:
Cengage Learning
College Algebra
Algebra
ISBN:
9781305115545
Author:
James Stewart, Lothar Redlin, Saleem Watson
Publisher:
Cengage Learning