et x be a random variable that represents hemogiobin count ((HC) in grams per 100 mi ters of whole blood. Then x has a dstribution that is approxiately or healthy adult women. Suppose that a female patient has taken 10 laboratory blood tests during the past year. The HC data sent to the patient's doctor are as follows. 15 18 15 20 15 12 15 16 17 11 A USE SALT (a) Use a calculator with sample mean and standard deviation keys to find ands. (Round your answers to two decimal places) (b) Does this information indicate that the population average HC for this patient is higher than 147 Use 0.01. O State the nul hypotheses H, and the alternate hypothesis H 14 () What is the value of the sample test statistic? (Round your answer to three decimal places.) C) Compute the Pvalue. (Round your answer to four decimal places
et x be a random variable that represents hemogiobin count ((HC) in grams per 100 mi ters of whole blood. Then x has a dstribution that is approxiately or healthy adult women. Suppose that a female patient has taken 10 laboratory blood tests during the past year. The HC data sent to the patient's doctor are as follows. 15 18 15 20 15 12 15 16 17 11 A USE SALT (a) Use a calculator with sample mean and standard deviation keys to find ands. (Round your answers to two decimal places) (b) Does this information indicate that the population average HC for this patient is higher than 147 Use 0.01. O State the nul hypotheses H, and the alternate hypothesis H 14 () What is the value of the sample test statistic? (Round your answer to three decimal places.) C) Compute the Pvalue. (Round your answer to four decimal places

MATLAB: An Introduction with Applications
6th Edition
ISBN:9781119256830
Author:Amos Gilat
Publisher:Amos Gilat
Chapter1: Starting With Matlab
Section: Chapter Questions
Problem 1P

Related questions
Question
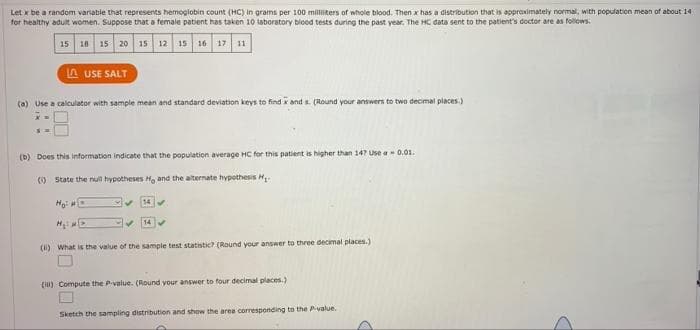
Transcribed Image Text:Let x be a random variable that represents hemoglobin count (HC) in grams per 100 milliters of whole blood. Then x has a distribution that is approximately normal, with population mean of about 14
for healthy adult women. Suppose that a temale patient has taken 10 laboratory blood tests during the past year, The HC data sent to the patient's doctor are as follows.
15 18 15 20 15 12 15 16 17 11
A USE SALT
(a) Use a calculator with sample mean and standard deviation keys to find x and s. (Round your answers to two decimal places.)
(b) Does this information indicate that the population average HC for this patient is higher than 147 Use a- 0.01.
(O State the nul hypotheses H, and the alternate hypothesis H
(1) What is the value of the sample test statistic? (Round your answer to three decimal places.)
(i) Compute the Pvalue. (Round your answer to four decimal places.)
Sketch the sampling distribution and show the area corresponding to the Pvalue.
Expert Solution
This question has been solved!
Explore an expertly crafted, step-by-step solution for a thorough understanding of key concepts.

Step by step
Solved in 4 steps with 1 images

Recommended textbooks for you
MATLAB: An Introduction with Applications
Statistics
ISBN:
9781119256830
Author:
Amos Gilat
Publisher:
John Wiley & Sons Inc

Probability and Statistics for Engineering and th…
Statistics
ISBN:
9781305251809
Author:
Jay L. Devore
Publisher:
Cengage Learning

Statistics for The Behavioral Sciences (MindTap C…
Statistics
ISBN:
9781305504912
Author:
Frederick J Gravetter, Larry B. Wallnau
Publisher:
Cengage Learning
MATLAB: An Introduction with Applications
Statistics
ISBN:
9781119256830
Author:
Amos Gilat
Publisher:
John Wiley & Sons Inc
Probability and Statistics for Engineering and th…
Statistics
ISBN:
9781305251809
Author:
Jay L. Devore
Publisher:
Cengage Learning
Statistics for The Behavioral Sciences (MindTap C…
Statistics
ISBN:
9781305504912
Author:
Frederick J Gravetter, Larry B. Wallnau
Publisher:
Cengage Learning

Elementary Statistics: Picturing the World (7th E…
Statistics
ISBN:
9780134683416
Author:
Ron Larson, Betsy Farber
Publisher:
PEARSON

The Basic Practice of Statistics
Statistics
ISBN:
9781319042578
Author:
David S. Moore, William I. Notz, Michael A. Fligner
Publisher:
W. H. Freeman

Introduction to the Practice of Statistics
Statistics
ISBN:
9781319013387
Author:
David S. Moore, George P. McCabe, Bruce A. Craig
Publisher:
W. H. Freeman