Consider the following computer output of a multiple regression analysis relating annual salary to years of education and years of work experience. Regression Statistics Multiple R R Square Adjusted R Square Standard Error Observations ANOVA 0.7352 0.5405 0.5205 2130.9497 49
Consider the following computer output of a multiple regression analysis relating annual salary to years of education and years of work experience. Regression Statistics Multiple R R Square Adjusted R Square Standard Error Observations ANOVA 0.7352 0.5405 0.5205 2130.9497 49

Glencoe Algebra 1, Student Edition, 9780079039897, 0079039898, 2018
18th Edition
ISBN:9780079039897
Author:Carter
Publisher:Carter
Chapter4: Equations Of Linear Functions
Section4.6: Regression And Median-fit Lines
Problem 17HP

Related questions
Question
100%
Please help asap
Transcribed Image Text:ck
^
ol
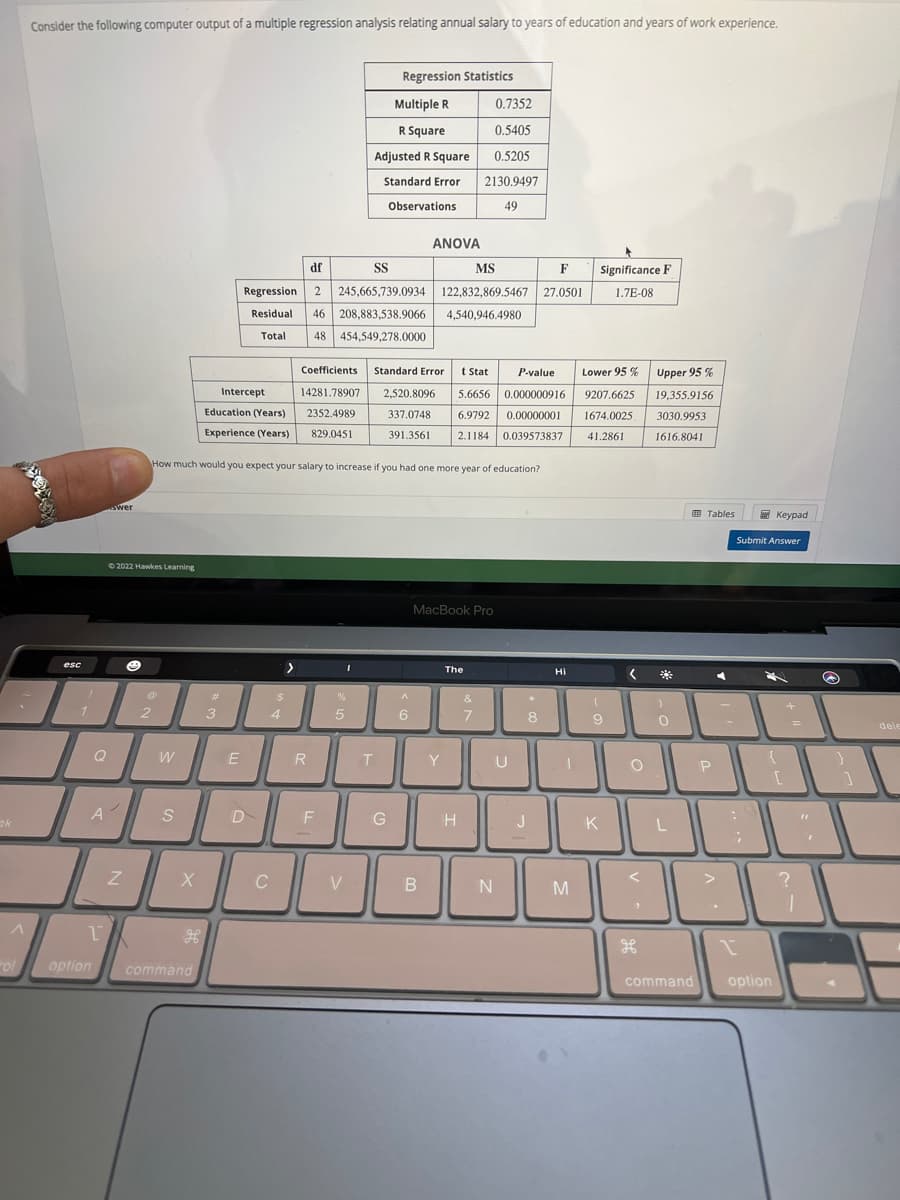
Consider the following computer output of a multiple regression analysis relating annual salary to years of education and years of work experience.
esc
1
1
A
1
option
wer
Ⓒ2022 Hawkes Learning
Z
☺
@
2
W
S
Coefficients Standard Error t Stat
14281.78907
2352.4989
829.0451
How much would you expect your salary to increase if you had one more year of education?
X
H
command
Intercept
Education (Years)
Experience (Years)
#
3
E
D
df
SS
MS
F
Regression 2 245,665,739.0934 122,832,869.5467 27.0501
Residual 46 208,883,538.9066
Total
4,540,946.4980
48 454,549,278.0000
C
$
4
R
F
I
%
5
V
Regression Statistics
Multiple R
R Square
Adjusted R Square
Standard Error
T
Observations
G
ANOVA
A
6
P-value
Lower 95%
2,520.8096 5.6656 0.000000916 9207.6625
337.0748 6.9792 0.00000001
1674.0025
391.3561 2.1184 0.039573837 41.2861
B
MacBook Pro
0.7352
0.5405
0.5205
2130.9497
49
Y
The
H
&
7
N
U
8
J
Hi
1
Significance F
1.7E-08
M
9
K
<
O
<
H
Upper 95 %
19,355.9156
3030.9953
1616.8041
0
L
command
Tables
P
>
Keypad
Submit Answer
:
1
{
option
[
?
1
"
@
}
1
dele
Expert Solution
This question has been solved!
Explore an expertly crafted, step-by-step solution for a thorough understanding of key concepts.

Step by step
Solved in 2 steps

Recommended textbooks for you
Glencoe Algebra 1, Student Edition, 9780079039897…
Algebra
ISBN:
9780079039897
Author:
Carter
Publisher:
McGraw Hill


Big Ideas Math A Bridge To Success Algebra 1: Stu…
Algebra
ISBN:
9781680331141
Author:
HOUGHTON MIFFLIN HARCOURT
Publisher:
Houghton Mifflin Harcourt
Glencoe Algebra 1, Student Edition, 9780079039897…
Algebra
ISBN:
9780079039897
Author:
Carter
Publisher:
McGraw Hill
Big Ideas Math A Bridge To Success Algebra 1: Stu…
Algebra
ISBN:
9781680331141
Author:
HOUGHTON MIFFLIN HARCOURT
Publisher:
Houghton Mifflin Harcourt

Algebra & Trigonometry with Analytic Geometry
Algebra
ISBN:
9781133382119
Author:
Swokowski
Publisher:
Cengage

Algebra and Trigonometry (MindTap Course List)
Algebra
ISBN:
9781305071742
Author:
James Stewart, Lothar Redlin, Saleem Watson
Publisher:
Cengage Learning