Test the claim that the proportion of men who own cats is smaller than the proportion of women who own cats at the .10 significance level. The null and alternative hypothesis would be: O Ho: PM PF H₁ PM> PF Ho: PM F Η μM > με - Ho:μM – με H₁: UMF Ho: PM = PF H₁ PM PF O Ho: PM PF H₁ PM
Test the claim that the proportion of men who own cats is smaller than the proportion of women who own cats at the .10 significance level. The null and alternative hypothesis would be: O Ho: PM PF H₁ PM> PF Ho: PM F Η μM > με - Ho:μM – με H₁: UMF Ho: PM = PF H₁ PM PF O Ho: PM PF H₁ PM

Holt Mcdougal Larson Pre-algebra: Student Edition 2012
1st Edition
ISBN:9780547587776
Author:HOLT MCDOUGAL
Publisher:HOLT MCDOUGAL
Chapter11: Data Analysis And Probability
Section: Chapter Questions
Problem 8CR

Related questions
Question
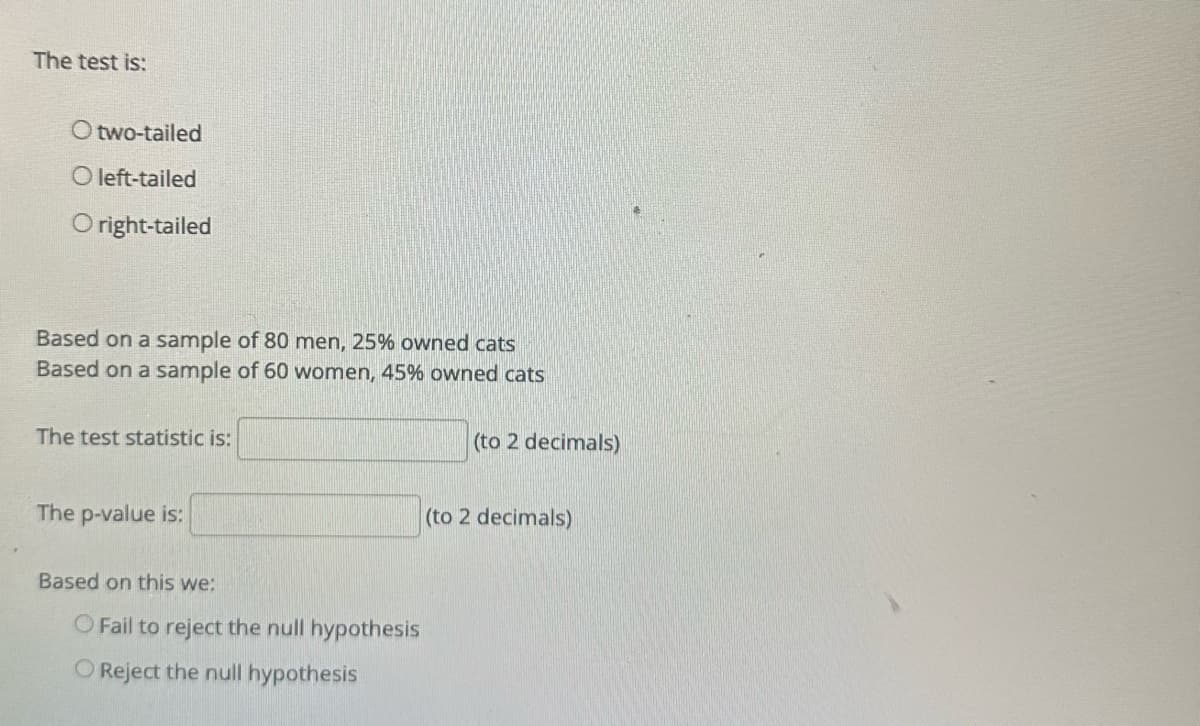
Transcribed Image Text:The test is:
Otwo-tailed
O left-tailed
Oright-tailed
Based on a sample of 80 men, 25% owned cats
Based on a sample of 60 women, 45% owned cats
The test statistic is:
The p-value is:
Based on this we:
O Fail to reject the null hypothesis
O Reject the null hypothesis
(to 2 decimals)
(to 2 decimals)
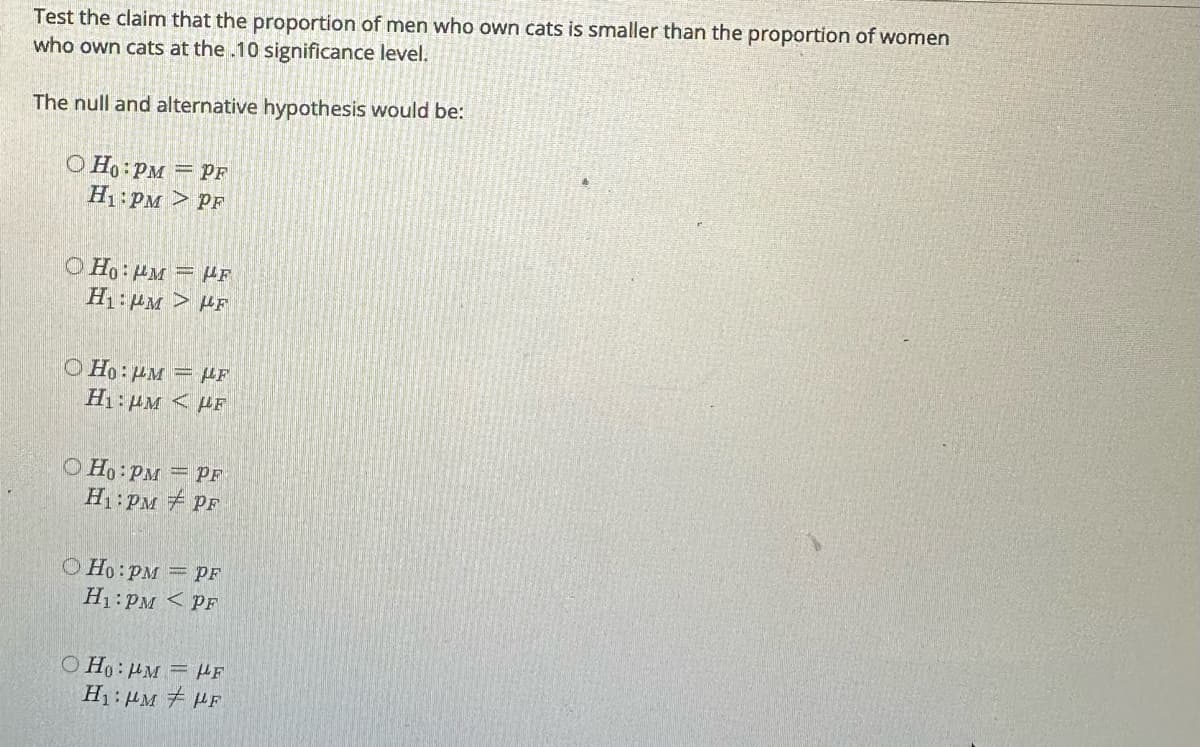
Transcribed Image Text:Test the claim that the proportion of men who own cats is smaller than the proportion of women
who own cats at the .10 significance level.
The null and alternative hypothesis would be:
O Ho: PM PF
H₁ PM > PF
O Ho: PM - F
H₁:PM> F
Ho: PM - F
H1:um < PLF
Ho: PM
H₁: PM
PF
PF
O Ho: PM = PF
H₁ PM PF
OHO: PM - HF
H₁: PM
F
Expert Solution
This question has been solved!
Explore an expertly crafted, step-by-step solution for a thorough understanding of key concepts.

This is a popular solution!

Trending now
This is a popular solution!

Step by step
Solved in 4 steps with 1 images

Recommended textbooks for you
Holt Mcdougal Larson Pre-algebra: Student Edition…
Algebra
ISBN:
9780547587776
Author:
HOLT MCDOUGAL
Publisher:
HOLT MCDOUGAL

College Algebra (MindTap Course List)
Algebra
ISBN:
9781305652231
Author:
R. David Gustafson, Jeff Hughes
Publisher:
Cengage Learning

Glencoe Algebra 1, Student Edition, 9780079039897…
Algebra
ISBN:
9780079039897
Author:
Carter
Publisher:
McGraw Hill
Holt Mcdougal Larson Pre-algebra: Student Edition…
Algebra
ISBN:
9780547587776
Author:
HOLT MCDOUGAL
Publisher:
HOLT MCDOUGAL
College Algebra (MindTap Course List)
Algebra
ISBN:
9781305652231
Author:
R. David Gustafson, Jeff Hughes
Publisher:
Cengage Learning
Glencoe Algebra 1, Student Edition, 9780079039897…
Algebra
ISBN:
9780079039897
Author:
Carter
Publisher:
McGraw Hill