Consider the following Cumulative frequency age for some sample of persons. Age Cumulative frequency 1-5 7 6 - 10 14 11 - 15 19 16 – 20 22 21 – 25 24 What is the number of persons whose age from 21 to 25 ?
Consider the following Cumulative frequency age for some sample of persons. Age Cumulative frequency 1-5 7 6 - 10 14 11 - 15 19 16 – 20 22 21 – 25 24 What is the number of persons whose age from 21 to 25 ?

Glencoe Algebra 1, Student Edition, 9780079039897, 0079039898, 2018
18th Edition
ISBN:9780079039897
Author:Carter
Publisher:Carter
Chapter10: Statistics
Section10.6: Summarizing Categorical Data
Problem 31PPS

Related questions
Question
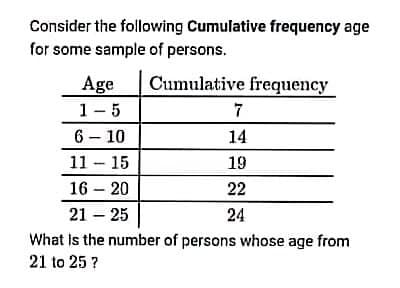
Transcribed Image Text:Consider the following Cumulative frequency age
for some sample of persons.
Age
Cumulative frequency
1-5
7
6 - 10
14
11 - 15
19
16 – 20
22
21 – 25
24
What is the number of persons whose age from
21 to 25 ?
Expert Solution
This question has been solved!
Explore an expertly crafted, step-by-step solution for a thorough understanding of key concepts.

Step by step
Solved in 2 steps with 2 images

Recommended textbooks for you
Glencoe Algebra 1, Student Edition, 9780079039897…
Algebra
ISBN:
9780079039897
Author:
Carter
Publisher:
McGraw Hill
Glencoe Algebra 1, Student Edition, 9780079039897…
Algebra
ISBN:
9780079039897
Author:
Carter
Publisher:
McGraw Hill