Consider the following data for a dependent variable y and two independent variables, ¤1 and x2. 12 29 12 94 47 10 109 24 17 113 51 17 178 41 95 52 19 176 75 8 171 36 12 118 59 13 143 77 16 211 The estimated regression equation for these data is ŷ = –16.20 + 1.90x1 + 4.93x2 Here SST = 15,059.6, SSR = 14,242.3, s = 0.2030, and Sin = 0.812? a. Test for a significant relationship among 21, 82, and y. Use a = 0.05. F = | (to 2 decimals) The p-value is - Select your answer - At a = 0.05, the overall model is - Select your answer b. Is B1 significant? Use a = 0.05 (to 2 decimals). Use t table.
Q: A sales manager collected the following data on annual sales for new customer accounts and the…
A: The independent variable is Years of experience. The dependent variable is Annual Sales. We have to…
Q: ou may need to use the appropriate technology to answer this question. Consider the following data…
A: a) Null Hypothesis: H0:β1=β2=0 Alternative Hypothesis: H1: At least one coefficient is not equal to…
Q: Determine the equation of the regression line for the following data, and compute the residuals.…
A: Computation: From the table, the summary of quantities are,
Q: Consider the following data for a dependent variable y and two independent variables, ₁ and 2; for…
A: For the given data R2 =? R2a =? Complete the sentence
Q: Consider the following data for a dependent variable y and two independent variables, 1 and 2; for…
A: Given data: x1 x2 y 30 13 94 47 11 109 24 18 112 51 16 179 41 5 94 51 20 176 75 8…
Q: The results of a sample of 7 data points are presented below in terms of the Average Daily…
A: Given data: Average daily temperature (x) Average monthly precipitation (y) 86 3.4 81 1.8…
Q: houschold a and their monlhly expenditure y. A sample from the study is shown below. 1 3000 2 4000 3…
A: In this case, monthly expenditure is dependent variable y and number of family members in the…
Q: The data below are the final exam scores of 10 randomly selected statistics students and the number…
A:
Q: Consider the following data for a dependent variable y and two independent variables, x1 and x2. x1…
A: The software output of regression equation for the given data is as follows: Predictor…
Q: The final test and exam averages for 20 randomly selected students taking a course in engineering…
A: Since you have posted a question with multiple sub-parts, we will solve first three sub- parts for…
Q: The following sample is collected as a conclusion of an observation: |2 3 47.3 66.7 4 6. 7 9 10 |Y…
A: The following equation is given in the question Now, Enter this data into Excel Taking log of Y…
Q: The data resulting from a random sample of 5 observations are shown below. Y is the dependent…
A: Since you have posted a question with multiple sub-parts, we will solve the first three subpartsfor…
Q: Given the following data pairs (x, y): (1, 1.24), (2, 5.23), (3, 7.24), (4, 7.60), (5, 9.97), (6,…
A: Solution
Q: Given are five observations for two variables, x and y. x 1 2 3 4 5 y 4 6 8 10 15 The…
A:
Q: A statistical program is recommended. Consider the following data for a dependent variable y and two…
A: There are 2 independent variables and 1 dependent variable. This is multiple regression analysis. We…
Q: . The following sample is collected as a conclusion of an observation: 1 3 4 8. 10 117.1 147.5 224.6…
A: Here we need to fit the given regression model to the data. Now since the regression model is not a…
Q: Consider the following dataset obtained from a sample. 13 y 1 21 3 24 2 16 7 29 18 8 33 15 6 29 7 13…
A: The multiple linear regression is used when there are more than 1 explanatory variables. The…
Q: For the following values of SSX, SSY, and SP, the Pearson correlation coefficient (r) is ______ and…
A: Given: SSX=270 SSY=50 SP=105
Q: Consider the following data for a dependent variable y and two independent variables, ¤1 and #2. 30…
A: Procedure to perform regression analysis using Excel: Enter the data of y, x1, and x2 (in different…
Q: Consider the following data on x = rainfall volume (m³) and y = runoff volume (m3) for a particular…
A: Hello! As you have posted more than 3 sub parts, we are answering the first 3 sub-parts. In case…
Q: Consider the following data on x- weight (pounds) and y price ($) for 10 road-racing bikes. Brand…
A: Level of significance = α = 0.05 Weight Price($) 17.8 2100 16.1 6250 14.9 8370 15.9 6200…
Q: Given are five observations collected in a regression study on two variables. x₁ 2 6 9 13 20 V₁9 19…
A: Solution-: Given data: X Y 2 9 6 19 9 7 13 26 20 21 We want to (a) Draw the scatter…
Q: Consider the following data set z represents the month, y represents the number of dialysis patients…
A: Given: X represents the month Y represents the number of dialysis patients
Q: Consider the following data for a dependent variable y and two independent variables, x, and x2. X1…
A: a) Therefore, we find that the regression equation is: y^=45.1+1.9*x1 predict y^ if x1=51 we…
Q: Consider the following data for a dependent variable y and two independent variables, x, and x,. X1…
A: The statistical software output for this problem is given below: Hence,a) Hypotheses: Option C…
Q: You may need to use the appropriate technology to answer this question. Consider the following data…
A: Correct option: Option 5
Q: Consider the following data for a dependent variable y and two independent variables, and a; for…
A: The question is about multiple regression Given : SST = 15182.9 SSR = 14052.2
Q: Given are five observations collected in a regression study on two variables. *269 13 20 Y, 9 19 7…
A: The independent variable is x. The dependent variable is y. This is simple linear regression model.
Q: A statistical program is recommended. Consider the following data for a dependent variable y and two…
A: a) The data inserted in EXCEL is defined below:
Q: Consider the following data on x = weight (pounds) and y = price ($) for 10 road-racing bikes. Brand…
A: These data provided the estimated regression equation ŷ = 28,648 − 1,444x. For these data, SSE =…
Q: The following table gives the ages and blood pressure of 9 women. Age (X) : 56 42 36 47 49 42 60 72…
A: From given data, X Y X*Y X*X Y*Y 56 147 8232 3136 21609 42 125 5250 1764 15625 36 118 4248…
Q: Consider the following data for a dependent variable y and two independent variables, ₁ and ₂. The…
A: Solution: Given information: k= 2 independent variables n= 10 observation SST= 15092.1 SSR=…
Q: Consider the following data for a dependent variable y and two independent variables, z and z; for…
A: There are two independent variables which are x1 and x2. The dependent variable is y. This is…
Q: Consider the following data for a dependent variable y and two independent variables, x, and x,. X1…
A: Since you have posted a question with multiple sub-parts, we will solve first three subparts for…
Q: The following table gives the ages and blood pressure of 9 women. Age (X) : 56 42 36 47 49 42 60 72…
A: From given data, X Y X*Y X*X Y*Y 56 147 8232 3136 21609 42 125 5250 1764 15625 36 118 4248…
Q: (a) Develop an estimated regression equation relating y to x1. (Round your numerical values to one…
A: (a) The regression analysis is conducted using EXCEL. The software procedure is given below: Enter…
Q: Consider the following data for a dependent variable y and two independent variables, x1 and x2. X1…
A: The hypothesis testing for significant relationship is done using the F-test. The F-test statistic…
Q: ou may need to use the appropriate technology to answer this question. Consider the following data…
A: Solution: Given information: n= 10 observation k=2 independent variables β1^=2.01 β2^=4.72…
Q: Consider the following data. x 3 4 6 7 y 1 2 4 5 We want to predict y based on observations of x.…
A: Note: Please repost part d,e as i can answer only 3 subparts as per my policy. Given data, X Y…
Q: 4. Predict Y when X1 = 94.8 and X2 = 11.2. Yhat = . 5. While testing for overall significance at…
A: It is asked to predict the value of Y when X1 = 94.8 and X2 = 11.2. That is , Y hat is required…
Q: Consider the following data for a dependent variable y and two independent variables, z and z3i for…
A:
Q: Consider the following data for a dependent variable y and two independent variables, x1 and x2.…
A: Given: x1 x2 y 30 12 95 47 10 108 25 17 112 51 16 178 40 5 94 51 19 175 74 7 170…
Q: Consider the following data on y = number of songs stored on an MP3 player and x = number of months…
A: Regression Equation: Excel Procedure: Enter X and Y in Excel>Data>Data Analysis>…
Q: Consider the following data set: Y 32 38 41 43 45 48 54 79 37 60 67 X 11 14 14 16 14 15 16 18 20 22…
A: from megastat output, regression analysis using megastat regression analysis
Q: A statistical program is recommended. Consider the following data for a dependent variable y and…
A: There are 2 independent variables and 1 dependent variable. This is multiple regression analysis. We…
Q: Consider the following data for a dependent variable y and two independent variables, X1 and X2. X1…
A: There are two independent variables which are named as x1 and x2. The dependent variable is y. We…
Q: For the following values of SSX, SSY, and SP, the Pearson correlation coefficient (r) is ______ and…
A: It is given that SSX = 170 SSY = 150 SP = 85
Q: Consider the following data for a dependent variable y and two independent variables, a and a2; for…
A: Coefficient of determination is given by, R2= SSR/SST Given that, SSR= 14139.4 And SST= 15175.6
Q: The following table lists the midterm and final exam scores for seven students in a statistics…
A: In this case, final exam scores is predicted on the basis of midterm exam scores. The final exam…
Q: Given the following data pairs (x.y), calculate the correlation coefficient. (1, 1.24), (2, 5.23),…
A: To find the correlation coefficient we will use Excel
I need help solving this and how to input in excel! Thank you!
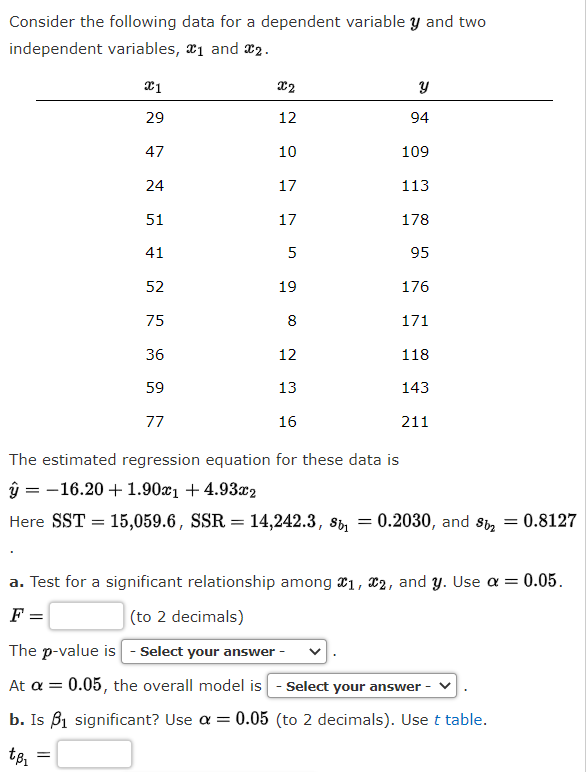
Trending now
This is a popular solution!
Step by step
Solved in 2 steps with 2 images
- The following fictitious table shows kryptonite price, in dollar per gram, t years after 2006. t= Years since 2006 0 1 2 3 4 5 6 7 8 9 10 K= Price 56 51 50 55 58 52 45 43 44 48 51 Make a quartic model of these data. Round the regression parameters to two decimal places.The following table shows the annual expenditures, in dollars, per customer unit for residential landline phone services and cellular phone services in the United States in the given year.† Year Landline Cell 2004 592 378 2006 542 524 2008 467 643 2010 401 760 Calculate the regression line for each type of service. (Let t be the time in years since 2004, L be the operating revenue of landline phone services and C be the expenditure of cellular services. Round your regression parameters to two decimal places.) L(t) = C(t) = Determine the expenditure level at which the two lines cross. Round your answer for the expenditure level to one decimal place. million dollarsUse the following table to find the equation of the regression line, between x and y x312304y210342
- Consider the following data for two variables, x and y. x 9 32 18 15 26 y 9 19 20 15 22 Develop an estimated regression equation for the data of the form ŷ = b0 + b1x + b2x2. (Round b0 to two decimal places and b1 to three decimal places and b2 to four decimal places.) ŷ = (c) Use the model from part (b) to predict the value of y when x = 20. (Round your answer to two decimal places.)Consider the following data for two variables, x and y. x 22 24 26 30 35 40 y 11 21 34 36 39 36 Develop an estimated regression equation for the data of the form ŷ = b0 + b1x + b2x2. (Round b0 to one decimal place and b1 to two decimal places and b2 to four decimal places.) ŷ = (e) Use the results from part (d) to test for a significant relationship between x, x2, and y. Use ? = 0.05. Is the relationship between x, x2, and y significant? Find the value of the test statistic. (Round your answer to two decimal places.) Find the p-value. (Round your answer to three decimal places.) p-value = (f) Use the model from part (d) to predict the value of y when x = 25. (Round your answer to three decimal places.)Given are five observations for two variables, x and y. xi 1 2 3 4 5 yi 4 6 6 11 13 Develop the estimated regression equation by computing the values of b0 and b1 using b1 = Σ(xi − x)(yi − y) Σ(xi − x)2 and b0 = y − b1x. ŷ = (e) Use the estimated regression equation to predict the value of y when x = 2.
- Consider the following regression equation representing the linear relationship between the Canada Child Benefit provided for a married couple with 3 children under the age of 6, based on their annual family net income: ŷ =121.09−0.57246xR2=0.894 where y = annual Canada Child Benefit paid (in $100s) x = net annual family income (in $1000s) Source: Canada Revenue Agency a. As the net annual family income increases, does the Canada Child Benefit paid increase or decrease? Based on this, is the correlation between the two variables positive or negative?The Canada Child Benefit paid .The correlation between the two variables is .b. Calculate the correlation coefficient and determine if the relationship between the two variables is strong, moderate or weak.r= , the relationship is . Round to 3 decimal places c. Interpret the value of the slope as it relates to this relationship. For every $1 increase in annual family net income, there is a $0.57246 decrease in…Consider the following regression equation representing the linear relationship between the Canada Child Benefit provided for a married couple with 3 children under the age of 6, based on their annual family net income: ŷ =121.09−0.57246xR2=0.894 where y= annual Canada Child Benefit paid (in $100s) x = net annual family income (in $1000s) Source: Canada Revenue Agency a. As the net annual family income increases, does the Canada Child Benefit paid increase or decrease? Based on this, is the correlation between the two variables positive or negative?The Canada Child Benefit paid ? .The correlation between the two variables is ? .b. Calculate the correlation coefficient and determine if the relationship between the two variables is strong, moderate or weak.r= , the relationship is ? . Round to 3 decimal places c. Interpret the value of the slope as it relates to this relationship. For every $1 increase in annual family net income, there is a $0.57246 decrease in…The grades of a sample of 9 students on a prelim exam (x) and on the midterm exam (y) are shown below. Find the regression equation. y = 34.661 + 0.433x y = 0.777 + 12.0623x y = 12.0623 + 0.777x y = 34.661 - 0.433x
- Consider the following regression equation: Y = 30 + 8X. If SSE = 720 and SS Total = 1,200, then the correlation coefficient is ________. A) −0.632B) 0.70C) 0.632D) −0.70The following estimated regression equation is based on 30 observations. ŷ = 18.3 + 3.9x1 − 2.2x2 + 7.5x3 + 2.5x4 The values of SST and SSR are 1,805 and 1,762, respectively. a. Compute R2 = (to 3 decimals). b. Compute Ra2 = (to 3 decimals).From 8 observations the following results were obtainedΣXΣ =544, ΣY =552, ΣXY = 37560, ΣX^2 =37028, ΣY^2 =38132. Find i) the correlation co- efficient, ii) and, state the relationship, iii) the regression line equation = Y=mX+bY=mX+b