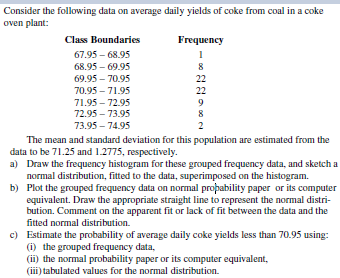
Consider the following data on average daily yields of coke from coal in a coke oven plant: Class Boundaries Frequency 67.95 – 68.95 68.95 – 69.95 8 69.95 – 70.95 22 70.95 – 71.95 22 71.95 – 72.95 9 72.95 – 73.95 8 73.95 – 74.95 2 The mean and standard deviation for this population are estimated from the data to be 71.25 and 1.2775, respectively. a) Draw the frequency histogram for these grouped frequency data, and sketch a normal distribution, fitted to the data, superimposed on the histogram. b) Plot the grouped frequency data on normal propability paper or its computer equivalent. Draw the appropriate straight line to represent the normal distri- bution. Comment on the apparent fit or lack of fit between the data and the fitted normal distribution. c) Estimate the probability of average daily coke yields less than 70.95 using: (i) the grouped frequency data, (ii) the normal probability paper or its computer equivalent, (iii) tabulated values for the normal distribution.


Inverse Normal Distribution
The method used for finding the corresponding z-critical value in a normal distribution using the known probability is said to be an inverse normal distribution. The inverse normal distribution is a continuous probability distribution with a family of two parameters.
Mean, Median, Mode
It is a descriptive summary of a data set. It can be defined by using some of the measures. The central tendencies do not provide information regarding individual data from the dataset. However, they give a summary of the data set. The central tendency or measure of central tendency is a central or typical value for a probability distribution.
Z-Scores
A z-score is a unit of measurement used in statistics to describe the position of a raw score in terms of its distance from the mean, measured with reference to standard deviation from the mean. Z-scores are useful in statistics because they allow comparison between two scores that belong to different normal distributions.


Trending now
This is a popular solution!

Step by step
Solved in 2 steps with 5 images


