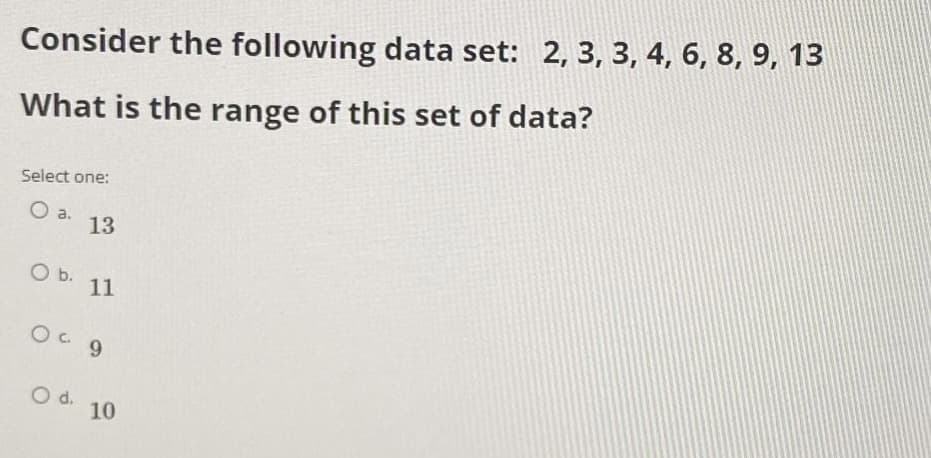
Consider the following data set: 2, 3, 3, 4, 6, 8, 9, 13 What is the range of this set of data? Select one: 13 b. O b. 11 O 9 Od. 10


Q: The mean of the following data values is 36. 19, 23, 35, 41, 42 A. True O B. False
A: Measure of central tendency measures the central or average value of a dataset. Measured of…
Q: Use the following data set to answer the questions. 13 15 20 20 20 20 20 20 20 23 27 31 a. What is…
A:
Q: Find the mean, median and mode of the given grouped data. Classes f 11-22 2…
A: Calculate Mean, Median, Mode from the following grouped data Class Frequency 11 - 22 2 23 -…
Q: Find the mode(s) for the given sample data. 20 31 46 31 49 31 49
A: Mode is the value that occurs more often. Sort the data in ascending order Here the value of 31…
Q: Given the following data: 32.1 31 35.3 23.4 29.6 26 25.6 The mean is: (Write only the number)…
A: i) From the given data is, 32.1, 31, 35.3, 23.4, 29.6, 26, 25.6 Therefore, sample size n=7 We have…
Q: Find the sample variance of the following data set. 6,12, 11, 11
A: Solution : Given : n= 4 Let, X = 6, 12, 11, 11 Sample variance is calculated by using following…
Q: Given the following data: 247, 113, 4, 29, 89 what is the class size of the distribution?
A: We can find the class size as below
Q: 1. From the following data, 8, 7, 9, 6, 8, 10, 9, 9, 5, 7, 4, 11,2 a) Find the Median, Lower…
A: Given data in ascending order is shown below 2, 4, 5, 6, 7, 7, 8, 8, 9, 9, 9, 10, 11 n = 13
Q: Use the following data set: 13, 8, 10, 7, 13, 9, 7, 11, 12, 10, 13 to answer questions The third…
A: From the provided information, The data values are as follow: 13, 8, 10, 7, 13, 9, 7, 11, 12, 10, 13
Q: Calculate the 76th percentile of the data shown 12.3 12.4 15.9 20.2 22 48.2 57.9 59.3 60.2 62.7…
A:
Q: Find the mean, median and mode of the following grouped data: Class Intervals…
A: To obtain the mean first, compute the mid point of the class intervals and use the following formula…
Q: Which of the following values will give us the most relevant information about a particular group of…
A: Hint: Different data sets may have the same mean. So, the Mean is not enough to get the relevant…
Q: Consider the following data set. Give the five number summary listing values in numerical order:…
A:
Q: Examine the following data set. 1.3, 2.5, 3.1, 4.2, 5.7, 5.7, 5.7, 6.4, 6.4, 8.9, 8.9, 9.1, 11.7,…
A: Given data, 1.3,2.5,3.1,4.2,5.7,5.7,5.7,6.4,6.4,8.9,8.9,9.1,11.7,12.2,12.6,13,14.4,15 What is the…
Q: 1. Write the following data sets in standard units. a. 8, 7, 6, 9, 5, 11, 10. b. 5, 4, 5, 6, 5, 5,…
A: Here by our policy I can solve the first question only. For Question 2 please post the question…
Q: 1.) Which of the following boxplots represents the dataset 4, 7, 10, 11, 12, 12, 14, 17, 18? A
A: To draw the boxplot, follow the following steps: Enter the data into Excel. Select the data and…
Q: Find the mean, median, and mode of the following data: 12 15 16 11 18 19 12 11 12 16 12 10 Mean =…
A:
Q: Consider the following data set: 0, 2, 2, 3, 5, 6, 3 (a) µ = (b) Variance = (c) σ = (Round…
A: Given data 0,2,2,3,5,6,3 n=7
Q: For this grouped data set: Scores | Frequencies 30-34 | 7 25-29 |…
A: The table shows the calculations required for obtaining the mean: Class(1) Frequency (f)(2) Mid…
Q: 1. Given the following data set, find the mean, median, and mode. 12, 15, 16, 19, 20, 20, 22, 23,…
A:
Q: Evaluate the first quartile O for the following data. 54, 69, 24, 75, 77, 83, 95, 100, 35, 110 O 110…
A:
Q: What is the first quartile of the following data set? 18, 20, 21, 23, 24, 26, 29, 30, 34, 37, 40 A.…
A:
Q: 2. Make a frequency table for the given data, and find the range, median, mode, and mean of the data…
A:
Q: Find the population variance for the following data set: 13,23,26,17,21
A: Given data set: 13,23,26,17,21
Q: 101 people were interviewed and were asked about the number of bicycles that they had in their…
A:
Q: Which of the following values will give us the most relevant information about a particular group of…
A: Sol:- Correct option :-
Q: 2.) Determine the mean, median, mode, and midrange of the following data set. 6, 8, 12, 13, 15, 11,…
A:
Q: Determine the number of modes for the following data set: 83, 3, 56, 72, 21, 48, 60, 18, 33 Enter: O…
A: The given data set is, 83, 3, 56, 72, 21, 48, 60, 18, 33 The ascending order of the data set is, 3,…
Q: For the given data set, find the a. mean b. median c. mode (or state that there is no mode) d.…
A:
Q: Find Mean, Median, Mode, sample variance and range for following set of data: 0.23 0.36 0.56 0.89…
A: The mean can be calculated as: The data can be arranged in ascending order as: 0.23, 0.36, 0.56,…
Q: Consider the following data: - 3, 1, 6, -9, 4,-3,-3 Step 1 of 3: Calculate the value of the sample…
A: Number of samples (n) = 7 -3 9 1 1 6 36 -9 81 4 16 -3 9 -3 9
Q: What is the mean for the following grouped data: Score Frequency 55 3 60 1 65 70 6. 75 4 80 6. 85 90…
A: Calculation of ∑f and ∑fx:
Q: Given the following data set, find the approximate value that corresponds to the 75th percentile.…
A: The data set is: 10, 44, 15, 23, 14, 18, 72, 56
Q: Consider the following data. 0,-11,-11,-11, –9, 0,0 Step 2 of 3: Determine the median of the given…
A: Arrange the data values in the ascending order. -11, -11, -11, -9, 0, 0, 0 Here, number of values…
Q: Use the following data set: 8, 3, 5, 2, 8, 4, 2, 6, 7, 5, 8 to answer questions The third quartile…
A:
Q: Of the data sets below, which has standard deviation 0? Set A: 1, 2, 3, 4 Set B: 1, 1,4,7 Set C: 0,…
A: The Data set D. 6,6,6,6 Σx=24 Σx2=62+62+62+62=144n=4The standard deviation is…
Q: Identify whether the following data set is a population or a sample. A news reporter is conducting a…
A:
Q: 2. Find the mean, median, and mode of each set of data: a. 45 48 56 62 75 75 78 84 b. 3 48 56 62 75…
A: Since you have posted a question with multiple sub-parts, we will solve first three sub- parts for…
Q: Which of the following percentiles represents the median of a data set? Select one: a. 100th b.…
A: to find which percentile represents the median .
Q: Find the mean, median, and mode for the following data set: 12 27 26 27 25 Find the mean madion ond…
A: As per Bartleby guideline expert have to answer first question only dear student please upload other…
Q: For the following data set, find Q1, Q2, Q3 and the interquartile range. 15, 12, 23, 15, 7, 8, 21,…
A: The following data has been given: 15, 12, 23, 15, 7, 8, 21, 10, 12, 14, 16, 24, 19
Q: Use the following data set to solve nos. 35 – 37. 20, 10, 8, 12, 8, 0, 5 35. What is the mode of the…
A: Given information- We have given the following data set- 10, 8, 20, 12, 8, 0, 5 We have to find the…
Q: Consider the data scores; 7, 10, 14, 19, 25. What is Q3 ?
A: First we have to arrange the data score in ascending order. Next we find the Q3 by using formula.
Q: Use the following data set: 13, 8, 10, 7, 13, 9, 7, 11, 12, 10, 13 to answen questions The data is…
A: Solution: We know that, Mode is the element in the data set that occurs most often. Unimodal is a…
Q: Given the following frequency table of values, is the mean or the median likely to be a better…
A: The frequency table is given below. Value Frequency 21 2 42 3 43 8 46 7 49 3 51 1…
Q: A sales manager recorded the number of sales made by each of the 300 salespeople working at his…
A: As per the guidelines, we are only allowed to solve three subparts. Please paste the other subparts…
Q: Find the mean, median, and mode of the data, if possible. If any of these measures cannot be found…
A: The sample data of seven admission test scores for a professional school is provided.Here, n = 7.The…
Q: The mode of the following data set is { 125, 15, 87, 113, 68, 15, 87, 68, 15, 113, 79 } i Select…
A: Option C is correct option. Mode is 15.
Q: A sample of 10 adult men gave the following data
A: height weight 62 120 62 140 63 130 65 150 66 142 67 130 68 135 68 175 70 149…
Q: What is the RANGE of the following grouped data? Class Frequency 2.7 2.9 3.0 – 3.2 6. 3.3 - 3.5 12…
A: The given grouped data is Class Frequency 2.7-2.9 5 3.0-3.2 6 3.3-3.5 12 3.6-3.8 9…

Step by step
Solved in 2 steps with 2 images
