
Managerial Economics: Applications, Strategies and Tactics (MindTap Course List)
14th Edition
ISBN:9781305506381
Author:James R. McGuigan, R. Charles Moyer, Frederick H.deB. Harris
Publisher:James R. McGuigan, R. Charles Moyer, Frederick H.deB. Harris
Chapter5: Business And Economic Forecasting
Section: Chapter Questions
Problem 1.3CE: Logarithms are especially useful for comparing series with two divergent scales since 10 percent...

Related questions
Question
3
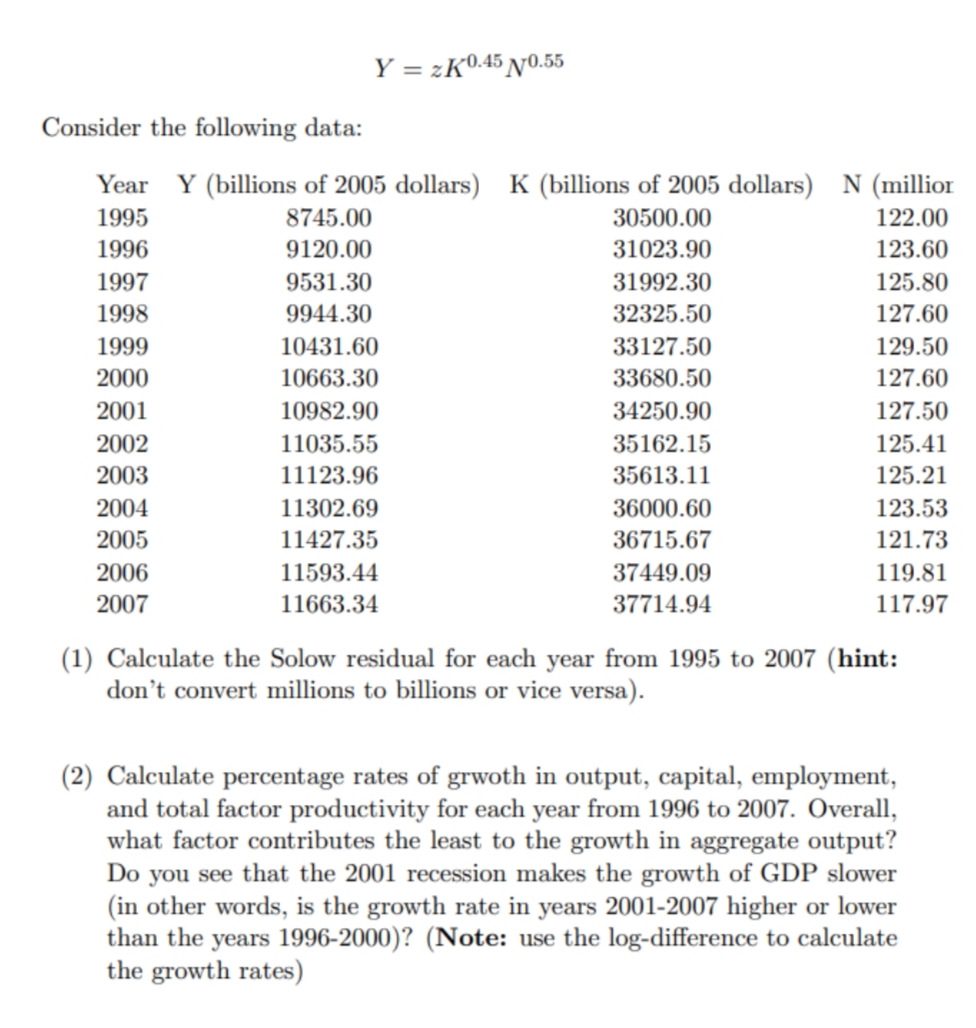
Transcribed Image Text:Y = zK0.45 N0.55
Consider the following data:
Year Y (billions of 2005 dollars) K (billions of 2005 dollars) N (millior
1995
8745.00
30500.00
122.00
1996
9120.00
31023.90
123.60
1997
9531.30
31992.30
125.80
1998
9944.30
32325.50
127.60
1999
10431.60
33127.50
129.50
2000
10663.30
33680.50
127.60
2001
10982.90
34250.90
127.50
2002
11035.55
35162.15
125.41
2003
11123.96
35613.11
125.21
2004
11302.69
36000.60
123.53
2005
11427.35
36715.67
121.73
2006
11593.44
37449.09
119.81
2007
11663.34
37714.94
117.97
(1) Calculate the Solow residual for each year from 1995 to 2007 (hint:
don't convert millions to billions or vice versa).
(2) Calculate percentage rates of grwoth in output, capital, employment,
and total factor productivity for each year from 1996 to 2007. Overall,
what factor contributes the least to the growth in aggregate output?
Do you see that the 2001 recession makes the growth of GDP slower
(in other words, is the growth rate in years 2001-2007 higher or lower
than the years 1996-2000)? (Note: use the log-difference to calculate
the growth rates)
Expert Solution
This question has been solved!
Explore an expertly crafted, step-by-step solution for a thorough understanding of key concepts.

This is a popular solution!

Trending now
This is a popular solution!

Step by step
Solved in 2 steps with 3 images

Knowledge Booster


Learn more about
Need a deep-dive on the concept behind this application? Look no further. Learn more about this topic, economics and related others by exploring similar questions and additional content below.Recommended textbooks for you
Managerial Economics: Applications, Strategies an…
Economics
ISBN:
9781305506381
Author:
James R. McGuigan, R. Charles Moyer, Frederick H.deB. Harris
Publisher:
Cengage Learning
Managerial Economics: Applications, Strategies an…
Economics
ISBN:
9781305506381
Author:
James R. McGuigan, R. Charles Moyer, Frederick H.deB. Harris
Publisher:
Cengage Learning