Consider the following estimated regression equation, based on 10 observations. ŷ = 29.1270 +0.5906x1 +0.4980x2 The values of SST and SSR are 6,724.125 and 6,216.375, respectively. a. Find SSE (to 2 decimals). b. Compute R² (to 3 decimals). c. Compute R (to 3 decimals).
Consider the following estimated regression equation, based on 10 observations. ŷ = 29.1270 +0.5906x1 +0.4980x2 The values of SST and SSR are 6,724.125 and 6,216.375, respectively. a. Find SSE (to 2 decimals). b. Compute R² (to 3 decimals). c. Compute R (to 3 decimals).

Functions and Change: A Modeling Approach to College Algebra (MindTap Course List)
6th Edition
ISBN:9781337111348
Author:Bruce Crauder, Benny Evans, Alan Noell
Publisher:Bruce Crauder, Benny Evans, Alan Noell
Chapter5: A Survey Of Other Common Functions
Section5.6: Higher-degree Polynomials And Rational Functions
Problem 1TU: The following fictitious table shows kryptonite price, in dollar per gram, t years after 2006. t=...

Related questions
Question
100%
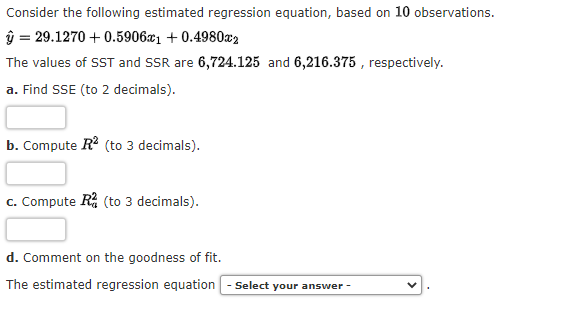
Transcribed Image Text:Consider the following estimated regression equation, based on 10 observations.
ŷ = 29.1270 +0.5906x1 +0.4980x2
The values of SST and SSR are 6,724.125 and 6,216.375, respectively.
a. Find SSE (to 2 decimals).
b. Compute R² (to 3 decimals).
c. Compute R (to 3 decimals).
d. Comment on the goodness of fit.
The estimated regression equation - Select your answer -
V
Expert Solution
This question has been solved!
Explore an expertly crafted, step-by-step solution for a thorough understanding of key concepts.

This is a popular solution!

Trending now
This is a popular solution!

Step by step
Solved in 4 steps

Recommended textbooks for you
Functions and Change: A Modeling Approach to Coll…
Algebra
ISBN:
9781337111348
Author:
Bruce Crauder, Benny Evans, Alan Noell
Publisher:
Cengage Learning
Functions and Change: A Modeling Approach to Coll…
Algebra
ISBN:
9781337111348
Author:
Bruce Crauder, Benny Evans, Alan Noell
Publisher:
Cengage Learning