Consider the following hypotheses: He: 159 HA: 159 A sample of 75 observations results in a sample mean of 146. The population standard deviation is known to be 3 a-1. Calculate the value of the test statistic. (Negative value should be indicated by a minus sign. Round final answer to places.) Test statistic a-2. Find the p-value. 0.05 p-value <0.10 Opvalue 0.10 Op-value < 0.01 0.01 p-value < 0.025 0.025 p-value < 0.05
Consider the following hypotheses: He: 159 HA: 159 A sample of 75 observations results in a sample mean of 146. The population standard deviation is known to be 3 a-1. Calculate the value of the test statistic. (Negative value should be indicated by a minus sign. Round final answer to places.) Test statistic a-2. Find the p-value. 0.05 p-value <0.10 Opvalue 0.10 Op-value < 0.01 0.01 p-value < 0.025 0.025 p-value < 0.05

MATLAB: An Introduction with Applications
6th Edition
ISBN:9781119256830
Author:Amos Gilat
Publisher:Amos Gilat
Chapter1: Starting With Matlab
Section: Chapter Questions
Problem 1P

Related questions
Question
100%
Answer completely. No need for long solutions. Just brief solutions with correct answers. I will upvote. Thank you
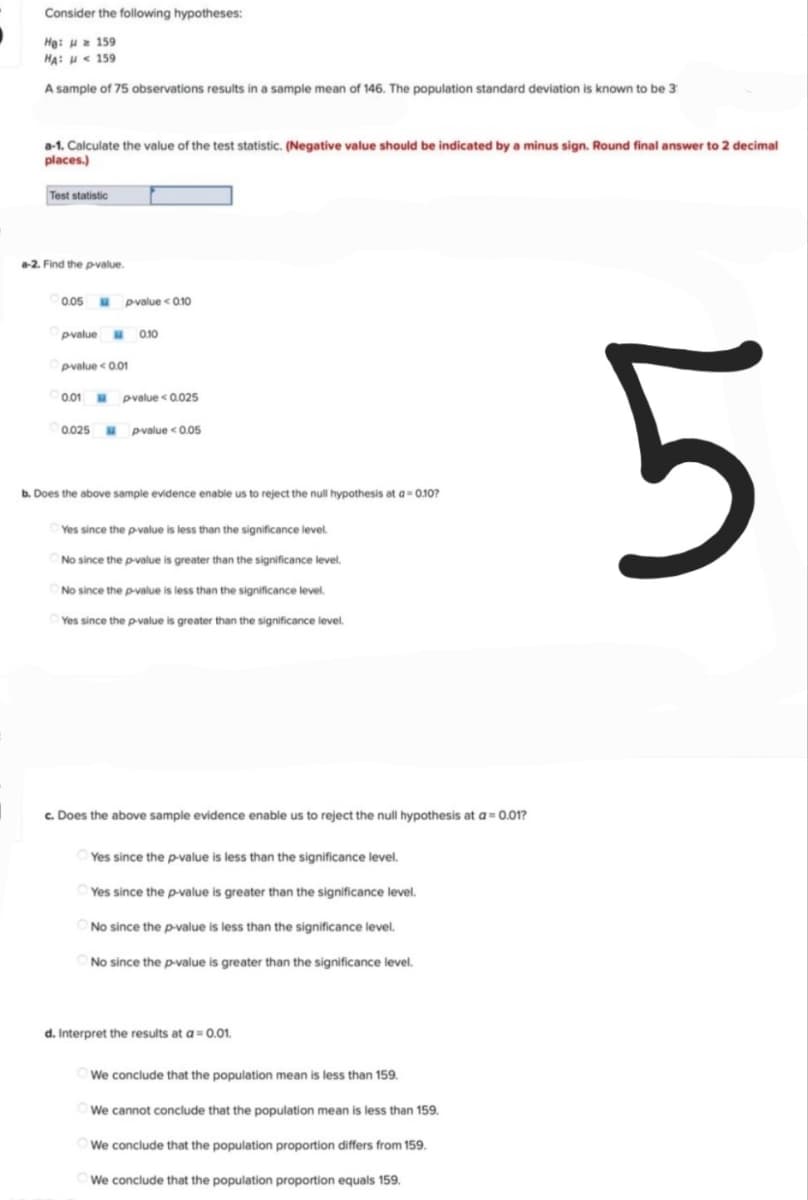
Transcribed Image Text:Consider the following hypotheses:
He: 159
MA: H « 159
A sample of 75 observations results in a sample mean of 146. The population standard deviation is known to be 3
a-1. Calculate the value of the test statistic. (Negative value should be indicated by a minus sign. Round final answer to 2 decimal
places.)
Test statistic
a-2. Find the p-value.
0.05
p-value < 0.10
p-value M 0.10
p-value < 0.01
0.01 p-value < 0.025
0.025
pvalue <0.05
5
b. Does the above sample evidence enable us to reject the null hypothesis at a=0.10?
Yes since the p-value is less than the significance level.
No since the p-value is greater than the significance level.
No since the p-value is less than the significance level.
Yes since the p-value is greater than the significance level.
c. Does the above sample evidence enable us to reject the null hypothesis at a = 0.01?
Yes since the p-value is less than the significance level.
Yes since the p-value is greater than the significance level.
No since the p-value is less than the significance level.
No since the p-value is greater than the significance level.
We conclude that the population mean is less than 159.
We cannot conclude that the population mean is less than 159.
We conclude that the population proportion differs from 159.
We conclude that the population proportion equals 159.
d. Interpret the results at a=0.01.
Expert Solution
This question has been solved!
Explore an expertly crafted, step-by-step solution for a thorough understanding of key concepts.

Step by step
Solved in 2 steps with 2 images

Recommended textbooks for you
MATLAB: An Introduction with Applications
Statistics
ISBN:
9781119256830
Author:
Amos Gilat
Publisher:
John Wiley & Sons Inc

Probability and Statistics for Engineering and th…
Statistics
ISBN:
9781305251809
Author:
Jay L. Devore
Publisher:
Cengage Learning

Statistics for The Behavioral Sciences (MindTap C…
Statistics
ISBN:
9781305504912
Author:
Frederick J Gravetter, Larry B. Wallnau
Publisher:
Cengage Learning
MATLAB: An Introduction with Applications
Statistics
ISBN:
9781119256830
Author:
Amos Gilat
Publisher:
John Wiley & Sons Inc
Probability and Statistics for Engineering and th…
Statistics
ISBN:
9781305251809
Author:
Jay L. Devore
Publisher:
Cengage Learning
Statistics for The Behavioral Sciences (MindTap C…
Statistics
ISBN:
9781305504912
Author:
Frederick J Gravetter, Larry B. Wallnau
Publisher:
Cengage Learning

Elementary Statistics: Picturing the World (7th E…
Statistics
ISBN:
9780134683416
Author:
Ron Larson, Betsy Farber
Publisher:
PEARSON

The Basic Practice of Statistics
Statistics
ISBN:
9781319042578
Author:
David S. Moore, William I. Notz, Michael A. Fligner
Publisher:
W. H. Freeman

Introduction to the Practice of Statistics
Statistics
ISBN:
9781319013387
Author:
David S. Moore, George P. McCabe, Bruce A. Craig
Publisher:
W. H. Freeman