Consider the following hypothesis test. Ho: µ 1 - µ 2 = 0 Ha: µ 1 - µ 2 0 The following results are from independent samples taken from two populations. Sample 1 Sample 2 ni = 35 n 2 = 40 | X 1 = 13.6 X 2 = 10.1 S 1 = 5.3 S 2 = 8.6 a. What is the value of the test statistic (to 2 decimals)? b. What is the degrees of freedom for the t distribution? (Round down your answer to the whole number) c. What is the p-value? Use z-table. The area in the upper tail is Select ; two-tailed p-value is between select d. At a = .05, what is your conclusion? p-value is Select Но
Consider the following hypothesis test. Ho: µ 1 - µ 2 = 0 Ha: µ 1 - µ 2 0 The following results are from independent samples taken from two populations. Sample 1 Sample 2 ni = 35 n 2 = 40 | X 1 = 13.6 X 2 = 10.1 S 1 = 5.3 S 2 = 8.6 a. What is the value of the test statistic (to 2 decimals)? b. What is the degrees of freedom for the t distribution? (Round down your answer to the whole number) c. What is the p-value? Use z-table. The area in the upper tail is Select ; two-tailed p-value is between select d. At a = .05, what is your conclusion? p-value is Select Но

MATLAB: An Introduction with Applications
6th Edition
ISBN:9781119256830
Author:Amos Gilat
Publisher:Amos Gilat
Chapter1: Starting With Matlab
Section: Chapter Questions
Problem 1P

Related questions
Topic Video
Question
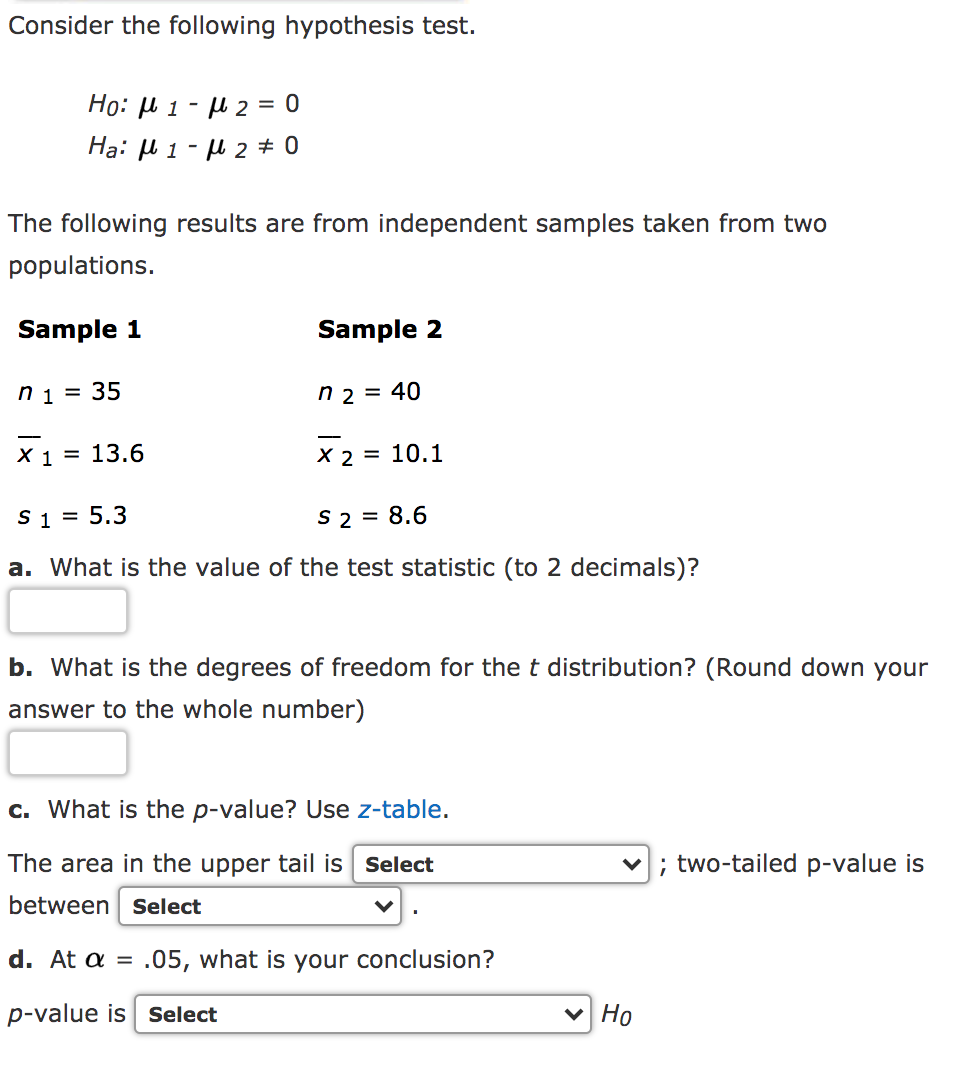
Transcribed Image Text:Consider the following hypothesis test.
Ho: u 1 - µ 2 = 0
Hạ: µ 1 - µ 2 ± 0
The following results are from independent samples taken from two
populations.
Sample 1
Sample 2
ni = 35
n 2 = 40
X 1 = 13.6
X 2 = 10.1
S 1 = 5.3
S 2 = 8.6
a. What is the value of the test statistic (to 2 decimals)?
b. What is the degrees of freedom for thet distribution? (Round down your
answer to the whole number)
c. What is the p-value? Use z-table.
The area in the upper tail is Select
; two-tailed p-value is
between select
d. At a = .05, what is your conclusion?
p-value is Select
v Ho
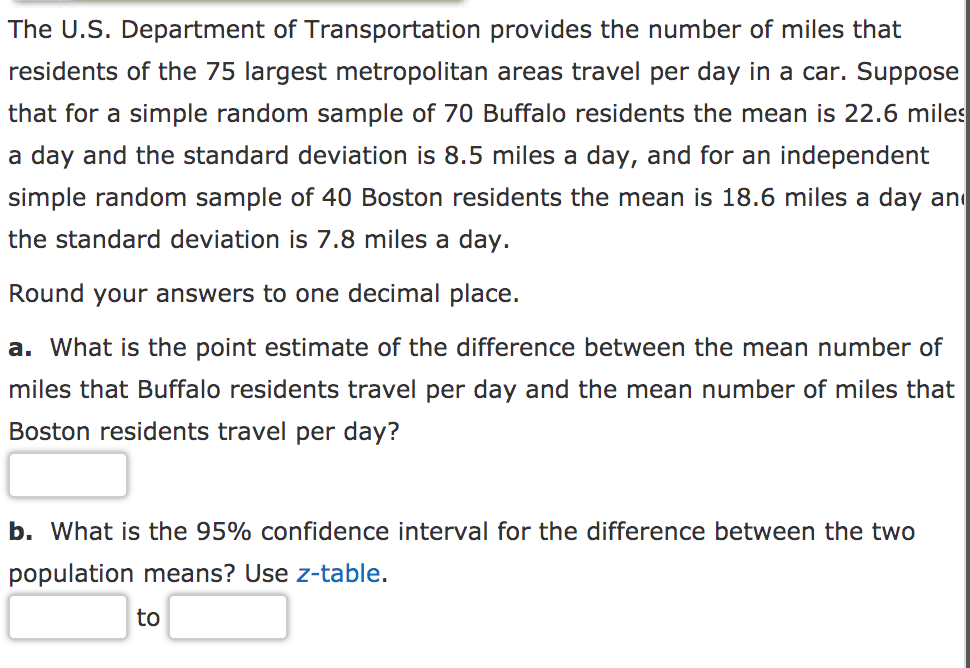
Transcribed Image Text:The U.S. Department of Transportation provides the number of miles that
residents of the 75 largest metropolitan areas travel per day in a car. Suppose
that for a simple random sample of 70 Buffalo residents the mean is 22.6 miles
a day and the standard deviation is 8.5 miles a day, and for an independent
simple random sample of 40 Boston residents the mean is 18.6 miles a day an
the standard deviation is 7.8 miles a day.
Round your answers to one decimal place.
a. What is the point estimate of the difference between the mean number of
miles that Buffalo residents travel per day and the mean number of miles that
Boston residents travel per day?
b. What is the 95% confidence interval for the difference between the two
population means? Use z-table.
to
Expert Solution
This question has been solved!
Explore an expertly crafted, step-by-step solution for a thorough understanding of key concepts.

This is a popular solution!

Trending now
This is a popular solution!

Step by step
Solved in 2 steps with 2 images

Knowledge Booster


Learn more about
Need a deep-dive on the concept behind this application? Look no further. Learn more about this topic, statistics and related others by exploring similar questions and additional content below.Recommended textbooks for you
MATLAB: An Introduction with Applications
Statistics
ISBN:
9781119256830
Author:
Amos Gilat
Publisher:
John Wiley & Sons Inc

Probability and Statistics for Engineering and th…
Statistics
ISBN:
9781305251809
Author:
Jay L. Devore
Publisher:
Cengage Learning

Statistics for The Behavioral Sciences (MindTap C…
Statistics
ISBN:
9781305504912
Author:
Frederick J Gravetter, Larry B. Wallnau
Publisher:
Cengage Learning
MATLAB: An Introduction with Applications
Statistics
ISBN:
9781119256830
Author:
Amos Gilat
Publisher:
John Wiley & Sons Inc
Probability and Statistics for Engineering and th…
Statistics
ISBN:
9781305251809
Author:
Jay L. Devore
Publisher:
Cengage Learning
Statistics for The Behavioral Sciences (MindTap C…
Statistics
ISBN:
9781305504912
Author:
Frederick J Gravetter, Larry B. Wallnau
Publisher:
Cengage Learning

Elementary Statistics: Picturing the World (7th E…
Statistics
ISBN:
9780134683416
Author:
Ron Larson, Betsy Farber
Publisher:
PEARSON

The Basic Practice of Statistics
Statistics
ISBN:
9781319042578
Author:
David S. Moore, William I. Notz, Michael A. Fligner
Publisher:
W. H. Freeman

Introduction to the Practice of Statistics
Statistics
ISBN:
9781319013387
Author:
David S. Moore, George P. McCabe, Bruce A. Craig
Publisher:
W. H. Freeman