Consider the following Ricardian model with 2 countries and 2 goods. The table below provides information on the size of countries' labor force and their productivity in producing each good. India China 60 Labor Supply 350 workers workers Juice 3 workers 7 workers Tea 2 workers 5 workers What is the pattern of trade? Explain What is the maximum free trade price of tea in terms of juice for free trade to be profitable? Explain.
Consider the following Ricardian model with 2 countries and 2 goods. The table below provides information on the size of countries' labor force and their productivity in producing each good. India China 60 Labor Supply 350 workers workers Juice 3 workers 7 workers Tea 2 workers 5 workers What is the pattern of trade? Explain What is the maximum free trade price of tea in terms of juice for free trade to be profitable? Explain.

Chapter18: International Trade And Comparative Advantage
Section: Chapter Questions
Problem 2TY

Related questions
Question
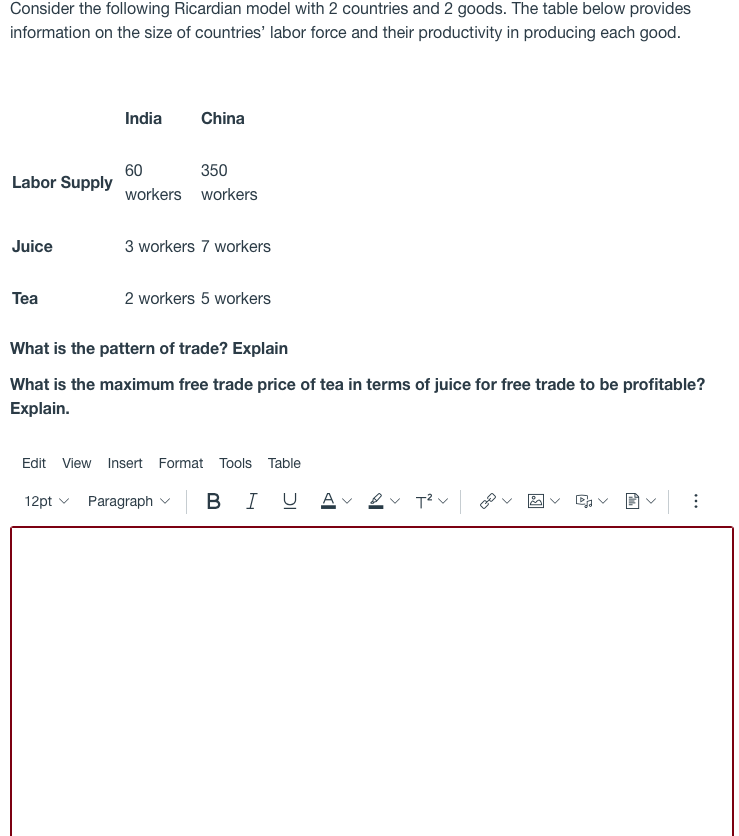
Transcribed Image Text:Consider the following Ricardian model with 2 countries and 2 goods. The table below provides
information on the size of countries' labor force and their productivity in producing each good.
India
China
60
Labor Supply
350
workers workers
Juice
3 workers 7 workers
Tea
2 workers 5 workers
What is the pattern of trade? Explain
What is the maximum free trade price of tea in terms of juice for free trade to be profitable?
Explain.
Edit View
Insert Format Tools Table
12pt v Paragraph
I U
U Av 2v T?v
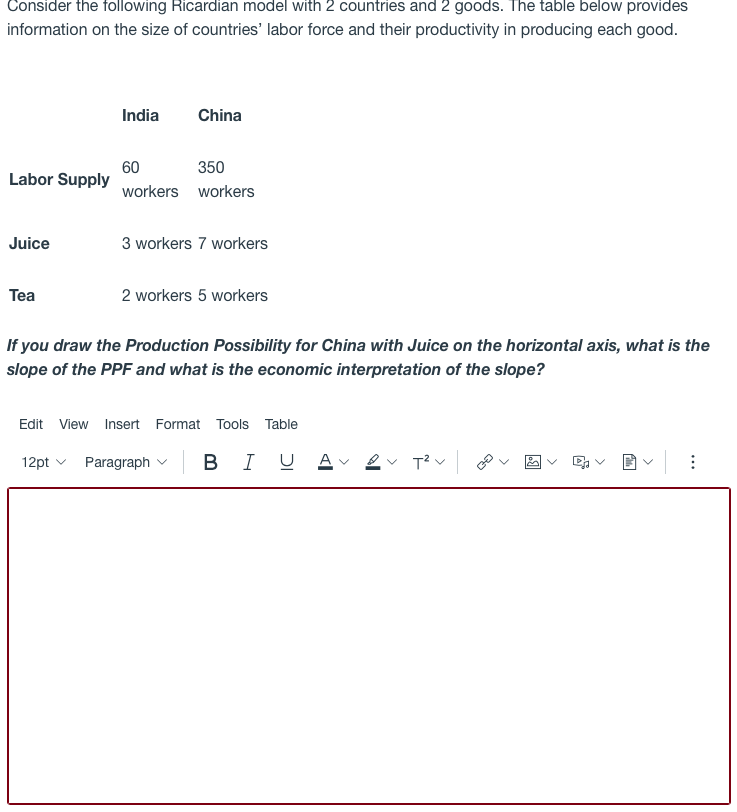
Transcribed Image Text:Consider the following Ricardian model with 2 countries and 2 goods. The table below provides
information on the size of countries' labor force and their productivity in producing each good.
India
China
350
60
Labor Supply
workers workers
Juice
3 workers 7 workers
Tea
2 workers 5 workers
If you draw the Production Possibility for China with Juice on the horizontal axis, what is the
slope of the PPF and what is the economic interpretation of the slope?
Edit View Insert Format Tools Table
12pt v
Paragraph v
B I U A ev T? v
Expert Solution
This question has been solved!
Explore an expertly crafted, step-by-step solution for a thorough understanding of key concepts.

Step by step
Solved in 2 steps with 1 images

Knowledge Booster


Learn more about
Need a deep-dive on the concept behind this application? Look no further. Learn more about this topic, economics and related others by exploring similar questions and additional content below.Recommended textbooks for you

Principles of Economics 2e
Economics
ISBN:
9781947172364
Author:
Steven A. Greenlaw; David Shapiro
Publisher:
OpenStax

Economics Today and Tomorrow, Student Edition
Economics
ISBN:
9780078747663
Author:
McGraw-Hill
Publisher:
Glencoe/McGraw-Hill School Pub Co
Principles of Economics 2e
Economics
ISBN:
9781947172364
Author:
Steven A. Greenlaw; David Shapiro
Publisher:
OpenStax
Economics Today and Tomorrow, Student Edition
Economics
ISBN:
9780078747663
Author:
McGraw-Hill
Publisher:
Glencoe/McGraw-Hill School Pub Co

Economics: Private and Public Choice (MindTap Cou…
Economics
ISBN:
9781305506725
Author:
James D. Gwartney, Richard L. Stroup, Russell S. Sobel, David A. Macpherson
Publisher:
Cengage Learning

Macroeconomics: Private and Public Choice (MindTa…
Economics
ISBN:
9781305506756
Author:
James D. Gwartney, Richard L. Stroup, Russell S. Sobel, David A. Macpherson
Publisher:
Cengage Learning