Consider the following table giving the marks obtained by students in an exam Mark Range fNoof Students Cumulative Frequency e0-20 begn 2 20 - 40 3 10 nenibo ai 40- 60 15 30 M.e.> 60-80 80-100 20 50 LO
Consider the following table giving the marks obtained by students in an exam Mark Range fNoof Students Cumulative Frequency e0-20 begn 2 20 - 40 3 10 nenibo ai 40- 60 15 30 M.e.> 60-80 80-100 20 50 LO

Glencoe Algebra 1, Student Edition, 9780079039897, 0079039898, 2018
18th Edition
ISBN:9780079039897
Author:Carter
Publisher:Carter
Chapter10: Statistics
Section10.1: Measures Of Center
Problem 9PPS

Related questions
Question
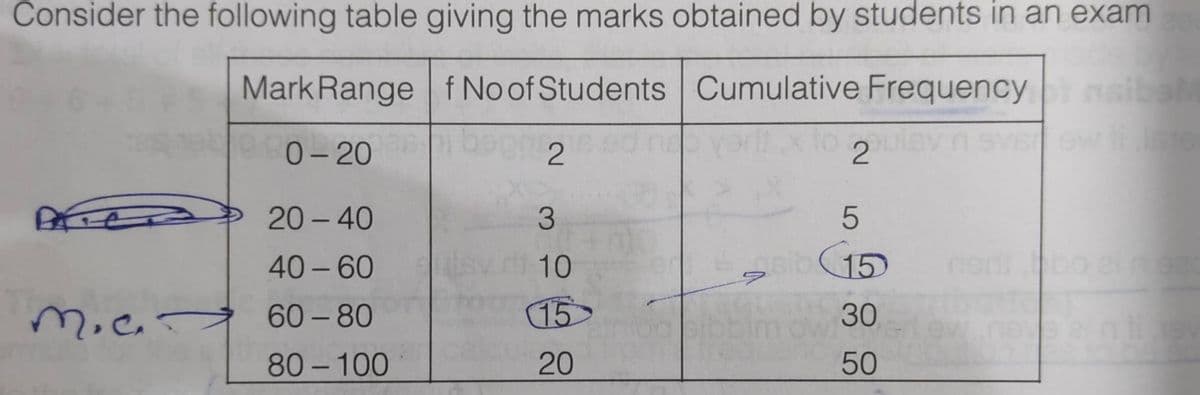
Transcribed Image Text:Consider the following table giving the marks obtained by students in an exam
Mark Range f No of Students Cumulative Frequency sibo
e0-20
To 2
2
20 - 40
3.
40 – 60
10
15
nedi
M.e.> 60- 80
80 -100
15
30
20
50
Expert Solution
This question has been solved!
Explore an expertly crafted, step-by-step solution for a thorough understanding of key concepts.

Step by step
Solved in 2 steps with 1 images

Recommended textbooks for you
Glencoe Algebra 1, Student Edition, 9780079039897…
Algebra
ISBN:
9780079039897
Author:
Carter
Publisher:
McGraw Hill
Glencoe Algebra 1, Student Edition, 9780079039897…
Algebra
ISBN:
9780079039897
Author:
Carter
Publisher:
McGraw Hill