You are given the following frequency distribution. Class Frequency 10 – 19 12 20 29 19 - 30 39 24 - 40 – 49 35 Then, the number of classes is Select one: O a. 100 ОЬ. 1 O c. 90 O d. 4
You are given the following frequency distribution. Class Frequency 10 – 19 12 20 29 19 - 30 39 24 - 40 – 49 35 Then, the number of classes is Select one: O a. 100 ОЬ. 1 O c. 90 O d. 4

Mathematics For Machine Technology
8th Edition
ISBN:9781337798310
Author:Peterson, John.
Publisher:Peterson, John.
Chapter29: Tolerance, Clearance, And Interference
Section: Chapter Questions
Problem 16A: Spacers are manufactured to the mean dimension and tolerance shown in Figure 29-12. An inspector...

Related questions
Question
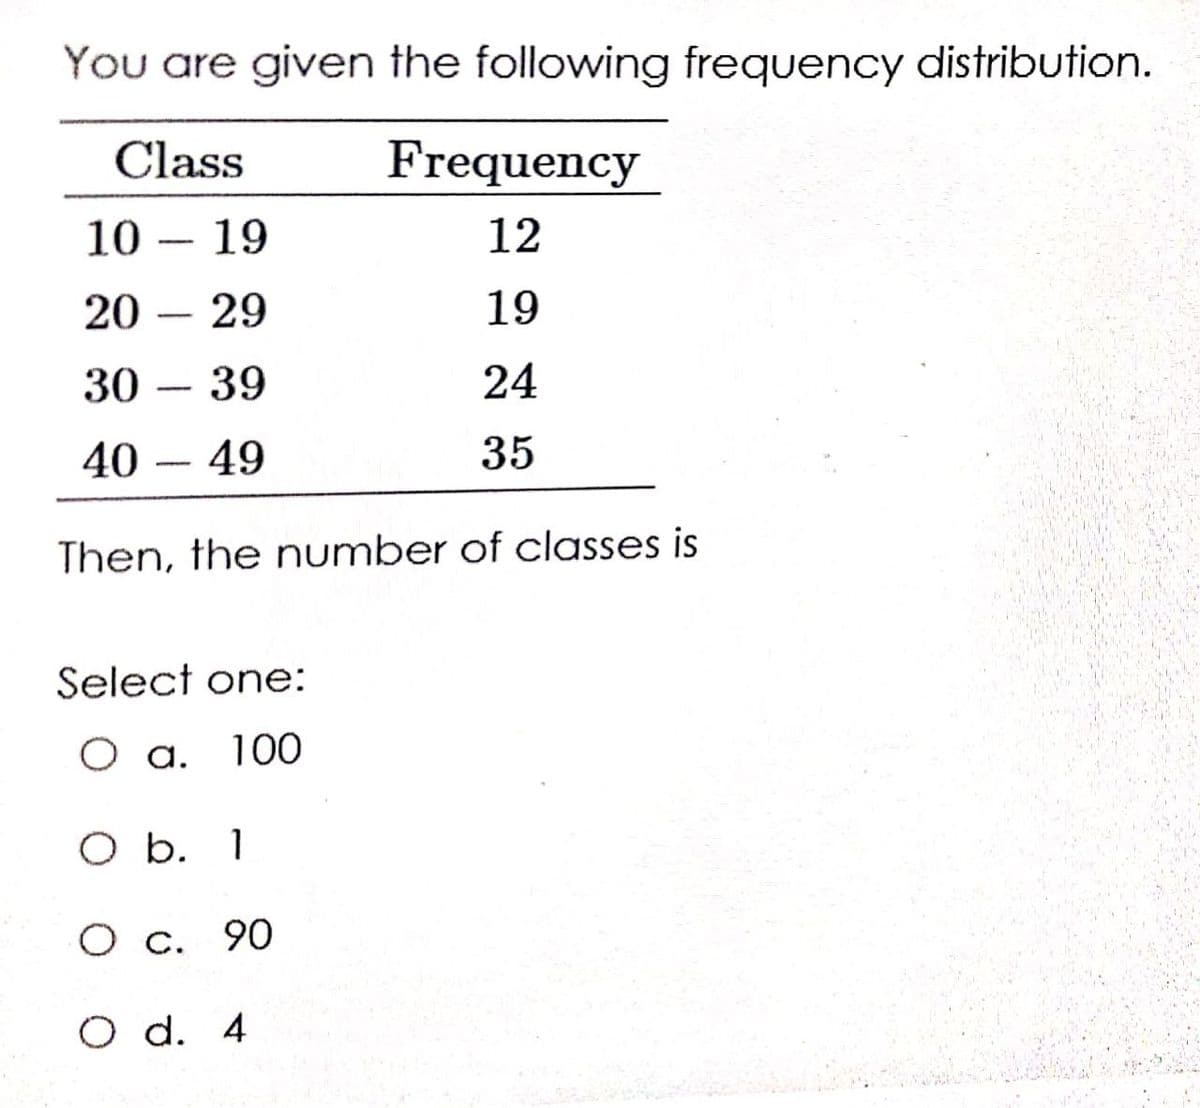
Transcribed Image Text:You are given the following frequency distribution.
Class
Frequency
10 – 19
12
20 – 29
19
30
39
24
-
40 – 49
35
Then, the number of classes is
Şelect one:
O a.
100
O b. 1
О с. 90
O d. 4
Expert Solution
This question has been solved!
Explore an expertly crafted, step-by-step solution for a thorough understanding of key concepts.

Step by step
Solved in 2 steps with 2 images

Recommended textbooks for you
Mathematics For Machine Technology
Advanced Math
ISBN:
9781337798310
Author:
Peterson, John.
Publisher:
Cengage Learning,
Mathematics For Machine Technology
Advanced Math
ISBN:
9781337798310
Author:
Peterson, John.
Publisher:
Cengage Learning,