Consider the following time series data. Quarter Year 1 1 1 2 2 3 4 Year Quarter 1 2 3 4 1 2 3 (a) Deseasonalize the time series using the adjusted seasonal indexes given below. (Round your answers to three decimal places.) Time Series Value Adjusted Seasonal Index Deseasonalized Value 4 1 2 3 4 4 2 3 4 4 2 3 4 6 3 5 8 7 6 6 Year 2 Year 3 9 6 3 5 8 7 6 6 1.230 0.734 0.870 1.165 1.230 0.734 0.870 1.165 1.230 0.734 0.870 1.165 · (b) Using statistical software, compute the linear trend regression equation for the deseasonalized data. (Let t= 1 denote the time series value in quarter 1 of year 1; t 2 denote the time series value in quarter 2 of year 1;... and t 12 denote the time series value in quarter 4 of year 3. Round your numerica three decimal places.) T₁-
Consider the following time series data. Quarter Year 1 1 1 2 2 3 4 Year Quarter 1 2 3 4 1 2 3 (a) Deseasonalize the time series using the adjusted seasonal indexes given below. (Round your answers to three decimal places.) Time Series Value Adjusted Seasonal Index Deseasonalized Value 4 1 2 3 4 4 2 3 4 4 2 3 4 6 3 5 8 7 6 6 Year 2 Year 3 9 6 3 5 8 7 6 6 1.230 0.734 0.870 1.165 1.230 0.734 0.870 1.165 1.230 0.734 0.870 1.165 · (b) Using statistical software, compute the linear trend regression equation for the deseasonalized data. (Let t= 1 denote the time series value in quarter 1 of year 1; t 2 denote the time series value in quarter 2 of year 1;... and t 12 denote the time series value in quarter 4 of year 3. Round your numerica three decimal places.) T₁-

MATLAB: An Introduction with Applications
6th Edition
ISBN:9781119256830
Author:Amos Gilat
Publisher:Amos Gilat
Chapter1: Starting With Matlab
Section: Chapter Questions
Problem 1P

Related questions
Question
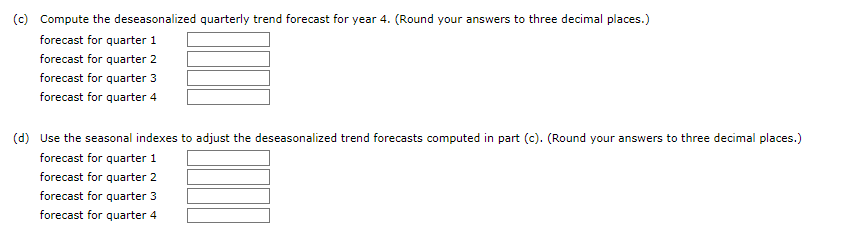
Transcribed Image Text:(c) Compute the deseasonalized quarterly trend forecast for year 4. (Round your answers to three decimal places.)
forecast for quarter 1
forecast for quarter 2
forecast for quarter 3
forecast for quarter 4
(d) Use the seasonal indexes to adjust the deseasonalized trend forecasts computed in part (c). (Round your answers to three decimal places.)
forecast for quarter 1
forecast for quarter 2
forecast for quarter 3
forecast for quarter 4
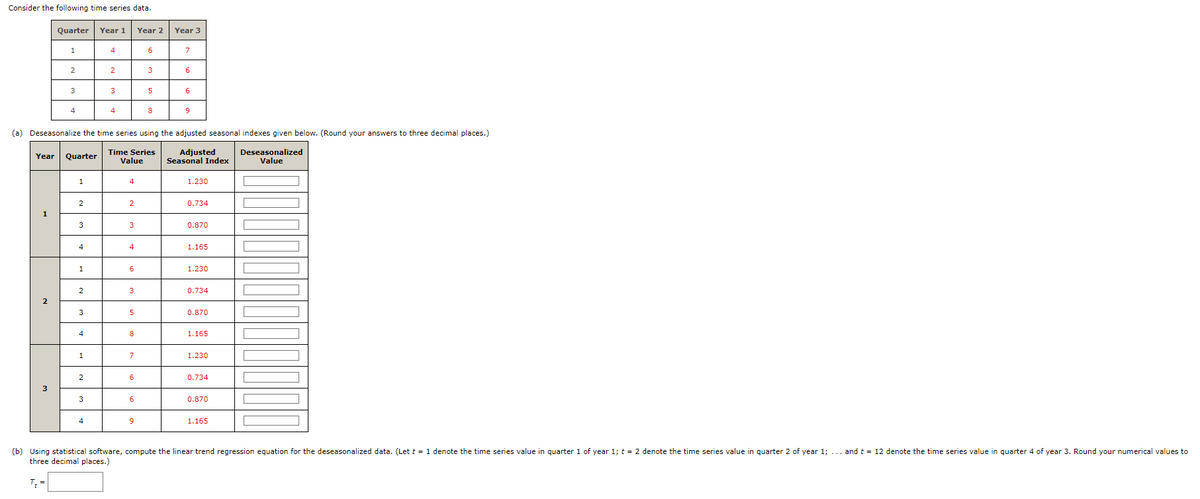
Transcribed Image Text:Consider the following time series data.
Quarter Year 1
1
1
2
2
3
3
Year Quarter
4
1
2
3
4
1
2
3
4
1
(a) Deseasonalize the time series using the adjusted seasonal indexes given below. (Round your answers to three decimal places.)
Time Series
Value
Adjusted
Seasonal Index
2
3
4
4
2
3
4
4
2
3
4
6
3
5
8
7
6
6
Year 2
9
6
3
5
8
Year 3
7
6
6
9
1.230
0.734
0.870
1.165
1.230
0.734
0.870
1.165
1.230
0.734
0.870
1.165
Deseasonalized
Value
T
(b) Using statistical software, compute the linear trend regression equation for the deseasonalized data. (Let t = 1 denote the time series value in quarter 1 of year 1; t = 2 denote the time series value in quarter 2 of year 1; ... and t = 12 denote the time series value in quarter 4 of year 3. Round your numerical values to
three decimal places.)
T₂ =
Expert Solution
This question has been solved!
Explore an expertly crafted, step-by-step solution for a thorough understanding of key concepts.

This is a popular solution!

Trending now
This is a popular solution!

Step by step
Solved in 4 steps with 3 images

Recommended textbooks for you
MATLAB: An Introduction with Applications
Statistics
ISBN:
9781119256830
Author:
Amos Gilat
Publisher:
John Wiley & Sons Inc

Probability and Statistics for Engineering and th…
Statistics
ISBN:
9781305251809
Author:
Jay L. Devore
Publisher:
Cengage Learning

Statistics for The Behavioral Sciences (MindTap C…
Statistics
ISBN:
9781305504912
Author:
Frederick J Gravetter, Larry B. Wallnau
Publisher:
Cengage Learning
MATLAB: An Introduction with Applications
Statistics
ISBN:
9781119256830
Author:
Amos Gilat
Publisher:
John Wiley & Sons Inc
Probability and Statistics for Engineering and th…
Statistics
ISBN:
9781305251809
Author:
Jay L. Devore
Publisher:
Cengage Learning
Statistics for The Behavioral Sciences (MindTap C…
Statistics
ISBN:
9781305504912
Author:
Frederick J Gravetter, Larry B. Wallnau
Publisher:
Cengage Learning

Elementary Statistics: Picturing the World (7th E…
Statistics
ISBN:
9780134683416
Author:
Ron Larson, Betsy Farber
Publisher:
PEARSON

The Basic Practice of Statistics
Statistics
ISBN:
9781319042578
Author:
David S. Moore, William I. Notz, Michael A. Fligner
Publisher:
W. H. Freeman

Introduction to the Practice of Statistics
Statistics
ISBN:
9781319013387
Author:
David S. Moore, George P. McCabe, Bruce A. Craig
Publisher:
W. H. Freeman