Consider the following time series data. Quarter Year 1 Year 2 Year 3 1 5 7 8 2 5 4. 6 4 6 8 (a) Construct a time series plot. What type of pattern exists in the data? The time series plot shows a linear trend and no seasonal pattern in the d 3.
Consider the following time series data. Quarter Year 1 Year 2 Year 3 1 5 7 8 2 5 4. 6 4 6 8 (a) Construct a time series plot. What type of pattern exists in the data? The time series plot shows a linear trend and no seasonal pattern in the d 3.

Functions and Change: A Modeling Approach to College Algebra (MindTap Course List)
6th Edition
ISBN:9781337111348
Author:Bruce Crauder, Benny Evans, Alan Noell
Publisher:Bruce Crauder, Benny Evans, Alan Noell
Chapter5: A Survey Of Other Common Functions
Section5.3: Modeling Data With Power Functions
Problem 6E: Urban Travel Times Population of cities and driving times are related, as shown in the accompanying...

Related questions
Question
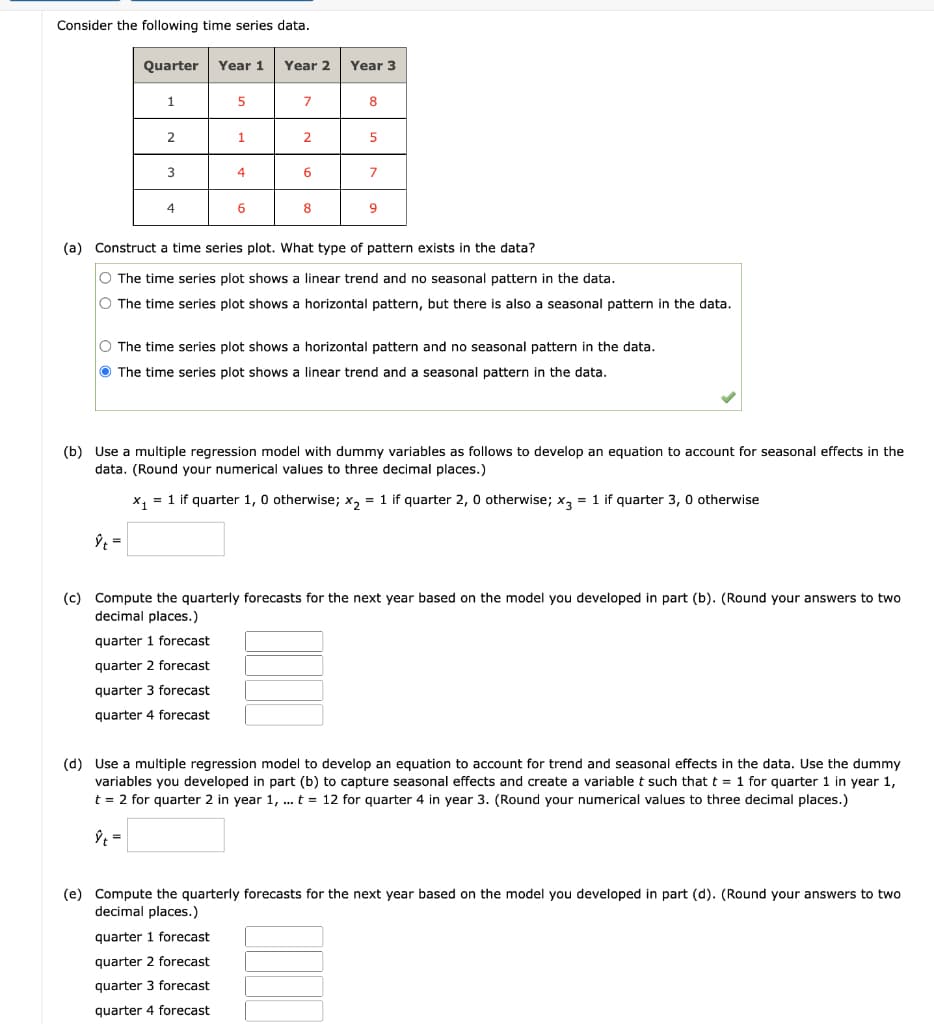
Transcribed Image Text:Consider the following time series data.
Quarter
Year 1
Year 2
Year 3
1
8.
2
5
3
4
6
7
8
9.
(a) Construct a time series plot. What type of pattern exists in the data?
O The time series plot shows a linear trend and no seasonal pattern in the data.
O The time series plot shows a horizontal pattern, but there is also a seasonal pattern in the data.
O The time series plot shows
horizontal pattern and no seasonal pattern in the data.
The time series plot shows
linear trend and a seasonal pattern in the data.
(b) Use a multiple regression model with dummy variables as follows to develop an equation to account for seasonal effects in the
data. (Round your numerical values to three decimal places.)
x, = 1 if quarter 1, 0 otherwise; x, = 1 if quarter 2, 0 otherwise; x, = 1 if quarter 3, 0 otherwise
ŷ =
(c) Compute the quarterly forecasts for the next year based on the model you developed in part (b). (Round your answers to two
decimal places.)
quarter 1 forecast
quarter 2 forecast
quarter 3 forecast
quarter 4 forecast
(d) Use a multiple regression model to develop an equation
variables you developed in part (b) to capture seasonal effects and create a variable t such that t = 1 for quarter 1 in year 1,
account for trend and seasonal effects in the data. Use the dummy
t = 2 for quarter 2 in year 1, ... t = 12 for quarter 4 in year 3. (Round your numerical values to three decimal places.)
Ý =
(e) Compute the quarterly forecasts for the next year based on the model you developed in part (d). (Round your answers to two
decimal places.)
quarter 1 forecast
quarter 2 forecast
quarter 3 forecast
quarter 4 forecast
Expert Solution
This question has been solved!
Explore an expertly crafted, step-by-step solution for a thorough understanding of key concepts.

This is a popular solution!

Trending now
This is a popular solution!

Step by step
Solved in 4 steps with 2 images

Recommended textbooks for you
Functions and Change: A Modeling Approach to Coll…
Algebra
ISBN:
9781337111348
Author:
Bruce Crauder, Benny Evans, Alan Noell
Publisher:
Cengage Learning
Functions and Change: A Modeling Approach to Coll…
Algebra
ISBN:
9781337111348
Author:
Bruce Crauder, Benny Evans, Alan Noell
Publisher:
Cengage Learning