Consider the following two figures. Japanese Yen per 1 US Dollar Graph Danish Krone per 1 Euro Graph 12 Mar 2018 16:00 UTC - 11 Apr 2018 16:48 UTC 12 Mar 2018 16.00 UTC - 11 Apr 2018 16:10 UTC 107.07591 7.4648491 6 39703 7.4552022 1d5.71416 105.03928 7.4359083 104.36040 | Mar 26 | Apr 2 7.4262613 Apr 9 Mar 12 Mar 12 Mar 19 Mar 19 Mar 26 | Apr 2 Apr 9 Which of the following statements is correct? OA. the left figure describes a fixed exchange rate; the right figure describes a fixed exchange rate B. the left figure describes a flexible exchange rate; the right figure describes a flexible exchange rate C. the left figure describes a fixed exchange rate; the right figure describes a flexible exchange rate D. the left figure describes a flexible exchange rate; the right figure describes a fixed exchange rate
Consider the following two figures. Japanese Yen per 1 US Dollar Graph Danish Krone per 1 Euro Graph 12 Mar 2018 16:00 UTC - 11 Apr 2018 16:48 UTC 12 Mar 2018 16.00 UTC - 11 Apr 2018 16:10 UTC 107.07591 7.4648491 6 39703 7.4552022 1d5.71416 105.03928 7.4359083 104.36040 | Mar 26 | Apr 2 7.4262613 Apr 9 Mar 12 Mar 12 Mar 19 Mar 19 Mar 26 | Apr 2 Apr 9 Which of the following statements is correct? OA. the left figure describes a fixed exchange rate; the right figure describes a fixed exchange rate B. the left figure describes a flexible exchange rate; the right figure describes a flexible exchange rate C. the left figure describes a fixed exchange rate; the right figure describes a flexible exchange rate D. the left figure describes a flexible exchange rate; the right figure describes a fixed exchange rate

MATLAB: An Introduction with Applications
6th Edition
ISBN:9781119256830
Author:Amos Gilat
Publisher:Amos Gilat
Chapter1: Starting With Matlab
Section: Chapter Questions
Problem 1P

Related questions
Question
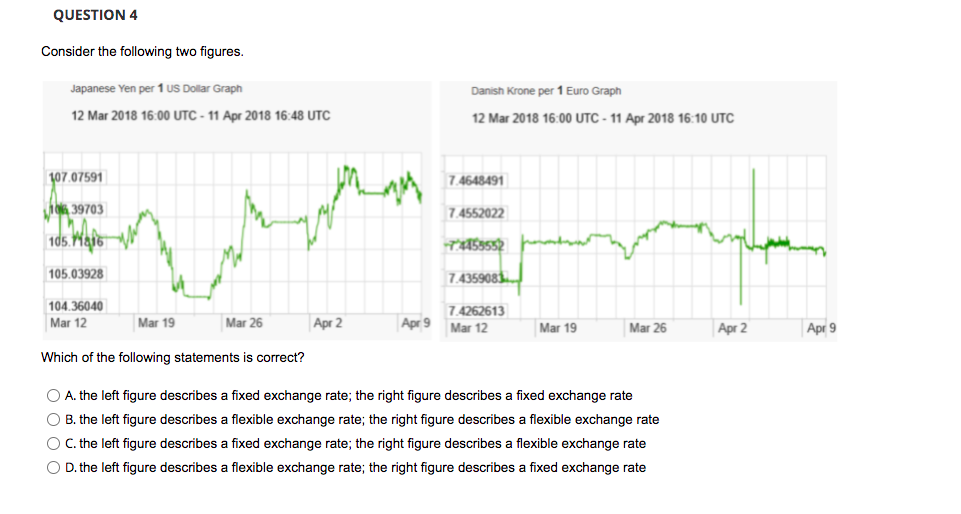
Transcribed Image Text:QUESTION 4
Consider the following two figures.
Japanese Yen per 1 US Dollar Graph
Danish Krone per 1 Euro Graph
12 Mar 2018 16:00 UTC - 11 Apr 2018 16:48 UTC
12 Mar 2018 16:00 UTC - 11 Apr 2018 16:10 UTC
107.07591
7.4648491
106 39703
7.4552022
1d5.71416
TAS9552
105.03928
7.4359083
104.36040
7.4262613
Mar 12
Mar 19
Mar 26
Apr 2
Apr 9
Mar 12
Mar 19
Mar 26
Apr 2
Apr 9
Which of the following statements is correct?
O A. the left figure describes a fixed exchange rate; the right figure describes a fixed exchange rate
O B. the left figure describes a flexible exchange rate; the right figure describes a flexible exchange rate
O C. the left figure describes a fixed exchange rate; the right figure describes a flexible exchange rate
O D. the left figure describes a flexible exchange rate; the right figure describes a fixed exchange rate
Expert Solution
This question has been solved!
Explore an expertly crafted, step-by-step solution for a thorough understanding of key concepts.

Step by step
Solved in 2 steps

Recommended textbooks for you
MATLAB: An Introduction with Applications
Statistics
ISBN:
9781119256830
Author:
Amos Gilat
Publisher:
John Wiley & Sons Inc

Probability and Statistics for Engineering and th…
Statistics
ISBN:
9781305251809
Author:
Jay L. Devore
Publisher:
Cengage Learning

Statistics for The Behavioral Sciences (MindTap C…
Statistics
ISBN:
9781305504912
Author:
Frederick J Gravetter, Larry B. Wallnau
Publisher:
Cengage Learning
MATLAB: An Introduction with Applications
Statistics
ISBN:
9781119256830
Author:
Amos Gilat
Publisher:
John Wiley & Sons Inc
Probability and Statistics for Engineering and th…
Statistics
ISBN:
9781305251809
Author:
Jay L. Devore
Publisher:
Cengage Learning
Statistics for The Behavioral Sciences (MindTap C…
Statistics
ISBN:
9781305504912
Author:
Frederick J Gravetter, Larry B. Wallnau
Publisher:
Cengage Learning

Elementary Statistics: Picturing the World (7th E…
Statistics
ISBN:
9780134683416
Author:
Ron Larson, Betsy Farber
Publisher:
PEARSON

The Basic Practice of Statistics
Statistics
ISBN:
9781319042578
Author:
David S. Moore, William I. Notz, Michael A. Fligner
Publisher:
W. H. Freeman

Introduction to the Practice of Statistics
Statistics
ISBN:
9781319013387
Author:
David S. Moore, George P. McCabe, Bruce A. Craig
Publisher:
W. H. Freeman