Consider the following. dQ 0.96 此 (x-24,999)0.04 * 225,000 (a) Use the marginal propensity to consume, dQ/dx, to write Q as a function of x where x is the income (in dollars) and Q is the income consumed (in dollars), Assume that familes who have annual incomes of $25,000 or less consume 100% of their income x 2 25,000 Q(x) = (b) Use the result of part (a) and a spreadsheet to complete the table showing the income consumed and the income saved, x - Q, for various incomes. (Round your answers to two decimal places.) X 25,000 50,000 100,000 150,000 Q x-e (c) Use a graphing utility to represent graphically the income consumed and saved. y 140000 140000 100000 100000 120000 120000 100000 0 80 000 80 000 100000 。 80000 60 000 60 000 80000 60 000 卡 60 000 40 000 40 000 40 000 40 000 x-Q 20 000 20 000 20 000 20 000 x-Q x-Q 75000 x X 75000 125000 25000 75000 125000 ① 0 25000 125000 X ①0 25000 。 x-Q 75000 125000 Y ①0 25000
Consider the following. dQ 0.96 此 (x-24,999)0.04 * 225,000 (a) Use the marginal propensity to consume, dQ/dx, to write Q as a function of x where x is the income (in dollars) and Q is the income consumed (in dollars), Assume that familes who have annual incomes of $25,000 or less consume 100% of their income x 2 25,000 Q(x) = (b) Use the result of part (a) and a spreadsheet to complete the table showing the income consumed and the income saved, x - Q, for various incomes. (Round your answers to two decimal places.) X 25,000 50,000 100,000 150,000 Q x-e (c) Use a graphing utility to represent graphically the income consumed and saved. y 140000 140000 100000 100000 120000 120000 100000 0 80 000 80 000 100000 。 80000 60 000 60 000 80000 60 000 卡 60 000 40 000 40 000 40 000 40 000 x-Q 20 000 20 000 20 000 20 000 x-Q x-Q 75000 x X 75000 125000 25000 75000 125000 ① 0 25000 125000 X ①0 25000 。 x-Q 75000 125000 Y ①0 25000

Managerial Economics: Applications, Strategies and Tactics (MindTap Course List)
14th Edition
ISBN:9781305506381
Author:James R. McGuigan, R. Charles Moyer, Frederick H.deB. Harris
Publisher:James R. McGuigan, R. Charles Moyer, Frederick H.deB. Harris
Chapter4: Estimating Demand
Section: Chapter Questions
Problem 6E

Related questions
Question
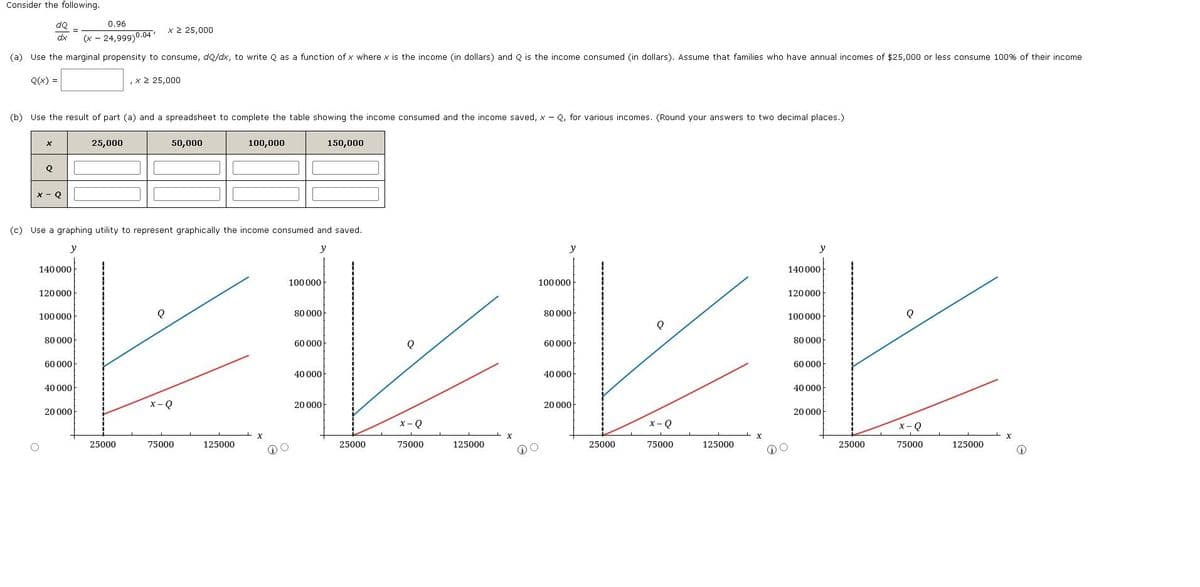
Transcribed Image Text:Consider the following.
0.96
dQ
dx
x ≥ 25,000
(x - 24,999)0.04
(a) Use the marginal propensity to consume, dQ/dx, to write Q as a function of x where x is the income (in dollars) and Q is the income consumed (in dollars). Assume that families who have annual incomes of $25,000 or less consume 100% of their income
Q(x) =
, x 2 25,000
(b) Use the result of part (a) and a spreadsheet to complete the table showing the income consumed and the income saved, x - Q, for various incomes. (Round your answers to two decimal places.)
x
25,000
50,000
100,000
150,000
Q
x-Q
(c) Use a graphing utility to represent graphically the income consumed and saved.
y
y
140 000
140 000
100 000
100 000
120 000
120 000
100 000
80 000
80 000
100 000
80 000
80 000
60 000
60 000
60 000
40 000
40 000
60 000
40 000
40 000
x-0
20 000
20 000
20 000
20 000
75000
25000
125000
X
25000
x-Q
75000
125000
25000
x-Q
75000
125000
25000
0
x-Q
75000
125000
Expert Solution
This question has been solved!
Explore an expertly crafted, step-by-step solution for a thorough understanding of key concepts.

This is a popular solution!

Trending now
This is a popular solution!

Step by step
Solved in 2 steps with 3 images

Recommended textbooks for you
Managerial Economics: Applications, Strategies an…
Economics
ISBN:
9781305506381
Author:
James R. McGuigan, R. Charles Moyer, Frederick H.deB. Harris
Publisher:
Cengage Learning
Managerial Economics: Applications, Strategies an…
Economics
ISBN:
9781305506381
Author:
James R. McGuigan, R. Charles Moyer, Frederick H.deB. Harris
Publisher:
Cengage Learning