Consider the income statement given below and perform Percentage Change Analysis for the entire Income Statement. Comment on what changes PepsiCo has observed as they move from the year 2009 to the year 2010.
Consider the income statement given below and perform Percentage Change Analysis for the entire Income Statement. Comment on what changes PepsiCo has observed as they move from the year 2009 to the year 2010.

Intermediate Accounting: Reporting And Analysis
3rd Edition
ISBN:9781337788281
Author:James M. Wahlen, Jefferson P. Jones, Donald Pagach
Publisher:James M. Wahlen, Jefferson P. Jones, Donald Pagach
Chapter7: Inventories: Cost Measurement And Flow Assumptions
Section: Chapter Questions
Problem 2RE: On January 1, Pope Enterprises inventory was 625,000. Pope made 950,000 of net purchases during the...

Related questions
Question
Consider the income statement given below and perform Percentage Change Analysis for the entire Income Statement.
Comment on what changes PepsiCo has observed as they move from the year 2009 to the year 2010.
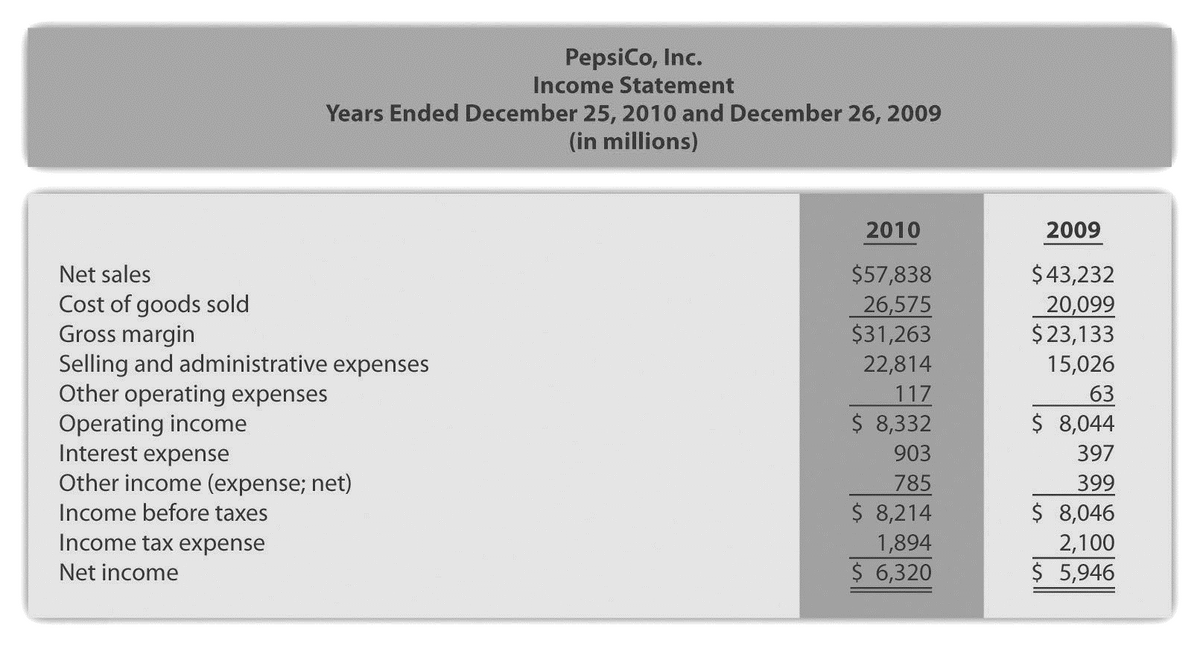
Transcribed Image Text:PepsiCo, Inc.
Income Statement
Years Ended December 25, 2010 and December 26, 2009
(in millions)
2010
2009
Net sales
$57,838
$43,232
Cost of goods sold
Gross margin
Selling and administrative expenses
Other operating expenses
Operating income
Interest expense
26,575
$31,263
20,099
$23,133
15,026
63
$ 8,044
22,814
117
$ 8,332
903
397
Other income (expense; net)
785
399
$ 8,046
2,100
$ 5,946
Income before taxes
$ 8,214
Income tax expense
1,894
Net income
$ 6,320
Expert Solution
This question has been solved!
Explore an expertly crafted, step-by-step solution for a thorough understanding of key concepts.

Step by step
Solved in 3 steps with 1 images

Knowledge Booster


Learn more about
Need a deep-dive on the concept behind this application? Look no further. Learn more about this topic, finance and related others by exploring similar questions and additional content below.Recommended textbooks for you
Intermediate Accounting: Reporting And Analysis
Accounting
ISBN:
9781337788281
Author:
James M. Wahlen, Jefferson P. Jones, Donald Pagach
Publisher:
Cengage Learning

Survey of Accounting (Accounting I)
Accounting
ISBN:
9781305961883
Author:
Carl Warren
Publisher:
Cengage Learning

Fundamentals of Financial Management (MindTap Cou…
Finance
ISBN:
9781337395250
Author:
Eugene F. Brigham, Joel F. Houston
Publisher:
Cengage Learning
Intermediate Accounting: Reporting And Analysis
Accounting
ISBN:
9781337788281
Author:
James M. Wahlen, Jefferson P. Jones, Donald Pagach
Publisher:
Cengage Learning
Survey of Accounting (Accounting I)
Accounting
ISBN:
9781305961883
Author:
Carl Warren
Publisher:
Cengage Learning
Fundamentals of Financial Management (MindTap Cou…
Finance
ISBN:
9781337395250
Author:
Eugene F. Brigham, Joel F. Houston
Publisher:
Cengage Learning