In the provided income statement image, can you plz calculate the profitability ratios: Gross Profit Margin for the 3 years (2021, 2020, 2019) and Profit Margin for 3 years) and could you discuss and explain the gross profit margin and profit margin and overall the company's profitability (or lack thereof).
In the provided income statement image, can you plz calculate the profitability ratios: Gross Profit Margin for the 3 years (2021, 2020, 2019) and Profit Margin for 3 years) and could you discuss and explain the gross profit margin and profit margin and overall the company's profitability (or lack thereof).

Managerial Accounting
15th Edition
ISBN:9781337912020
Author:Carl Warren, Ph.d. Cma William B. Tayler
Publisher:Carl Warren, Ph.d. Cma William B. Tayler
Chapter16: Financial Statement Analysis
Section: Chapter Questions
Problem 2PA

Related questions
Question
-
In the provided income statement image, can you plz calculate the profitability ratios: Gross Profit Margin for the 3 years (2021, 2020, 2019) and Profit Margin for 3 years) and could you discuss and explain the gross profit margin and profit margin and overall the company's profitability (or lack thereof).
also please can you show your calculations for the 3 years for each ratio
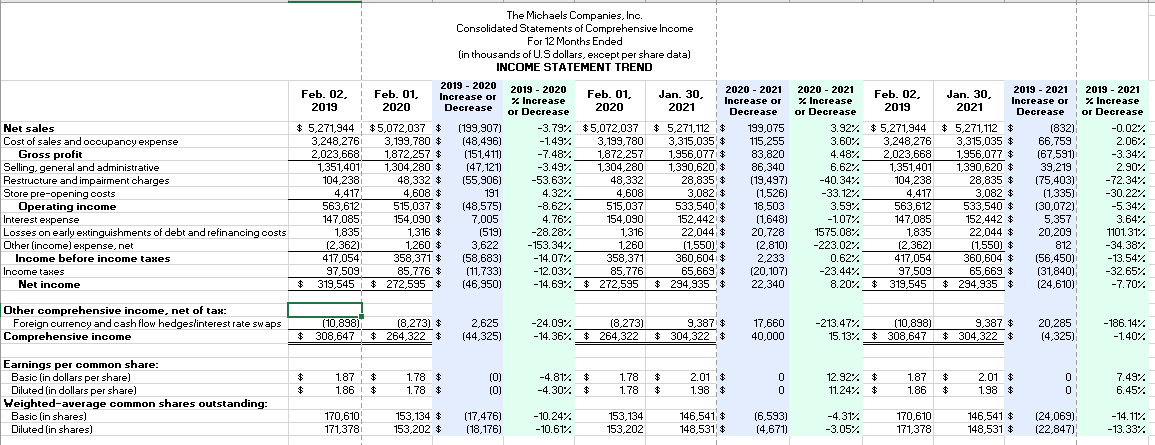
Transcribed Image Text:The Michaels Companies, Inc.
Consolidated Statements of Comprehensive Income
For 12 Months Ended
(in thousands of U.S dollars, except per share data)
INCOME STATEMENT TREND
2019 - 2020
2019 - 2020
x Increase
or Decrease
2020 - 2021
z Increase
or Decrease
2019 - 2021
z Increase
or Decrease
2020 - 2021
2019 - 2021
Feb. 02,
Jan. 30,
Feb. 01,
2020
Feb. 01,
Jan. 30,
Feb. 02,
Increase or
Decrease
Increase or
Increase or
Decrease
2019
2020
2021
2019
2021
Decrease
$ 5.271,944
$ 5,271,112 $
3.315.035 $
1,956.077.4
1,390,620
28,835
(832)
66,759
199,075
115,255
83,820
86,340
(19,497)
(1,526)
18,503
(1,648)
20,728
(2,810)
2,233
(20,107)
22,340
(199,907)
(48,496)
-3.79% $5,072,037
3,199,780
1,872,257
1,304,280
Net sales
$5,072,037 $
3,199,780 $
1,872,257 $
1,304,280 $
48,332 $
4,608 $
515,037 $
154,090 $
1,316 $
3.92% $ 5,271,944 $ 5,271,112 $
3,315,035 $
1,956,077 $
1,390,620 $
28.835 $
3,082
533,540 $
152,442 $
22,044 $
(1,550) $
360,604 $
65,669 $
$ 294,935 $
-0.02%
Cost of sales and occupancy expense
Gross profit
Selling, general and administrative
Restructure and impairment charges
Store pre-opening costs
Operating income
Interest expense
Losses on early extinguishments of debt and refinancing costs
Other (income) expense, net
3,248,276
2,023,668
1,351,401
104,238
-1.49%
3.60%
3,248,276
2,023,668
1,351,401
104,238
4,417
563,612
147,085
1,835
2.06%
(151,411)
(47,121)
(55,906)
-7.48%
4.48%
(67,591)
39,219
(75,403)
(1,335)
(30,072)
5,357
20,209
-3.34%
-3.49%
6.62%
2.90%
-53.63%
48,332
4,608
515,037
154,090
1,316
1,260
358,371
85,776
-40.34%
-72.34%
-30.22%
-5.34%
4,417
563,612
147,085
1,835
(2,362)i
417,054
191
4.32%
3,082 $
533,540 $
152,442 $
22.044 $
(1,550) $
360,60424
-33.12%
$
(48,575)
7,005
(519)
3,622
(58,683)
(11,733)
(46,950)
-8.62%
3.59%
4.76%
-28.28%
-1.07%
3.64%
1575.08%
1101.31%
1,260 $
358,371 $
85,776 *
$272,595$
-153.34%
-223.02%
(2,362)
417,054
812
-34.38%
Income before income taxes
-14.07%
0.62%
(56,450)
-13.54%
Income taxes
-23.44%
-32.65%
97,509
319,545
-12.03%
65,669 $
97.509
8.20% $ 319,545
(31,840)
(24,610)
Net income
-14.69% $ 272.595
$ 294,935 !$
-7.70%
Other comprehensive income, net of tax:
Foreign currenoy and oash flow hedgeslinterest rate swaps
Comprehensive income
(10,898)
308,647
2,625
(44,325)
9.387 $
$ 304,322 $
(8,273) $
-24.09%
(8,273)
17,660
40,000
-213.47%
(10,898)
308.647 $ 304,322
9,387 $
20,285
-186.14%
$ 264,322 $
-14.36% $ 264,322
15.13% $
(4,325)
-1.40%
Earnings per common share:
Basic (in dollars per share)
Diluted (in dollars per share)
Weighted-average common shares outstanding:
Basio (in shares)
Diluted (in shares)
1.87
1.78 $
(0)
(0)
-4.81% $
1.78
2.01 i$
12.92% $
1.87
2.01 $
7.49%
1.86
1.78 $
-4.30% $
1.78
1.98 $
11.24% $
1.86
1.98 $
6.45%
170,610
171,378
170,610
171,378
-14.11%
153,134 $
153,202 $
(17,476)
(18,176)
-10.24%
153,134
153,202
146,541 *
(6,593)
(4,671)
-4.31%
146,541 $
148,531 $
(24,069)
(22,847)
-10.61%
148,531, $
-3.05%
-13.33%
Expert Solution
This question has been solved!
Explore an expertly crafted, step-by-step solution for a thorough understanding of key concepts.

Step by step
Solved in 2 steps

Knowledge Booster


Learn more about
Need a deep-dive on the concept behind this application? Look no further. Learn more about this topic, accounting and related others by exploring similar questions and additional content below.Recommended textbooks for you
Managerial Accounting
Accounting
ISBN:
9781337912020
Author:
Carl Warren, Ph.d. Cma William B. Tayler
Publisher:
South-Western College Pub

Intermediate Accounting: Reporting And Analysis
Accounting
ISBN:
9781337788281
Author:
James M. Wahlen, Jefferson P. Jones, Donald Pagach
Publisher:
Cengage Learning

Financial Accounting: The Impact on Decision Make…
Accounting
ISBN:
9781305654174
Author:
Gary A. Porter, Curtis L. Norton
Publisher:
Cengage Learning
Managerial Accounting
Accounting
ISBN:
9781337912020
Author:
Carl Warren, Ph.d. Cma William B. Tayler
Publisher:
South-Western College Pub
Intermediate Accounting: Reporting And Analysis
Accounting
ISBN:
9781337788281
Author:
James M. Wahlen, Jefferson P. Jones, Donald Pagach
Publisher:
Cengage Learning
Financial Accounting: The Impact on Decision Make…
Accounting
ISBN:
9781305654174
Author:
Gary A. Porter, Curtis L. Norton
Publisher:
Cengage Learning
