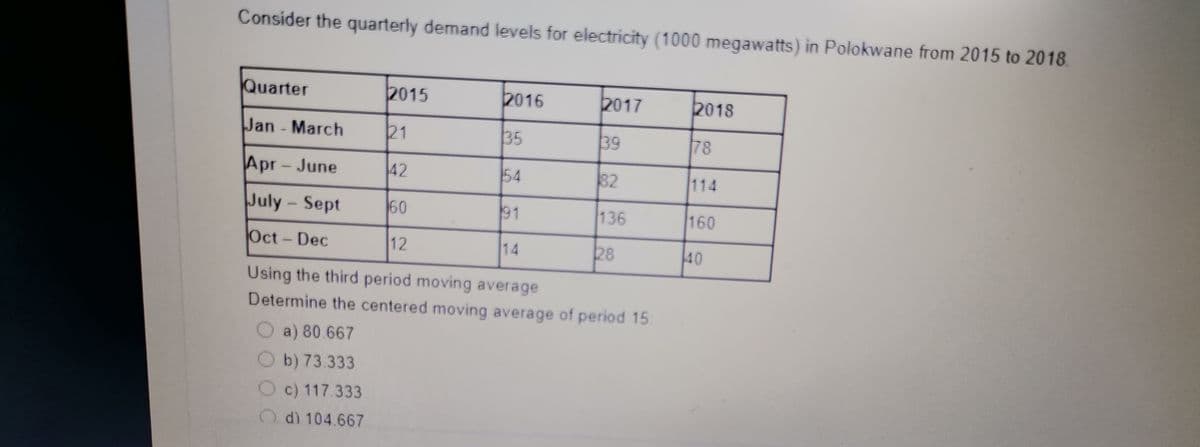
Consider the quarterly demand levels for electricity (1000 megawatts) in Polokwane from 2015 to 2018. Quarter 2015 2016 2017 2018 Jan - March 21 35 39 78 Apr-June 42 54 82 114 July-Sept 60 136 160 Oct-Dec 12 14 28 40 Using the third period moving average Determine the centered moving average of period 15


Q: What type of function would be best to model the data? Find the equation of that function. Report…
A: Enter the data in Excel.
Q: (a) Compute four-week and five-week moving averages for the time series. Week Time Series Value…
A: Answer:
Q: The table shows the average number of acres per farm in the United States for selected years. † Year…
A: Given data of average number of acres of farm in US per for selected years as shown below a) The…
Q: The table shows the number of people in North America who use email as a part of their jobs. North…
A:
Q: The table shows the national expenditures for health care (in billions of dollars) for selected…
A: NOTE: Refresh your page if you can't see any equations. . x= number of years after 2000…
Q: Consider the given data for the percent of participation of the 18-24-year-old group, y, as a…
A: Given: The percent of participation of the 18-24-year-old group, y, as a function of years after…
Q: 25. The scatterplot and the model in Fig. 61 describe the association between years and Apple…
A:
Q: QUESTION 1 Weekly closing prices (in RM) for Telstra for Sept 2015 - October 2015 is as follows:…
A: Since you have posted question with multiple sub-parts, we will solve first 3 sub parts for you. To…
Q: Table 1. Number of Car Travel per Quarter Year Quarter t y СМА: У 2013 1 1 664924 2013 2 672678…
A:
Q: Swordfish have a unique "heater organ" that maintains elevated eye and brain temperatures when…
A: In the given problem we have given that the scatter plot between Eye Temperature and Flicker Fusion…
Q: OS Life Expectancy at Birth of a Canadian Male Birth year 1920 1930 1940 1950 1960 1970 1980 1990…
A: a) Let x represents birth year since 1920 and y represents life expectancy at birth. Let x=0 for…
Q: Use a Linear Trend Line to forecast the demand for months 13 and 14 of the following time series:…
A: Introduction: Consider that x is the independent variable and y is the dependent variable. The size…
Q: The average daily sales (in litres) of milk at a country store are shown in Table 4 for each of the…
A: Trend is the general tendency of the data set to increase or decrease during a long period of time.…
Q: Below is a table of data that have been collected Price,p,($) Weekly Demand,s,(1,000s) 150 210 170…
A: Given Data: Price Weekly Demand 150 210 170 203 190 199 210 183 230 185 250 176…
Q: QUESTION ONE A supplier of school stationary recorded its quarterly sales figures ($00s) for the…
A:
Q: Ulmudiall males. Life Expectancy at Birth of a Canadian Male Birth year 1920 1930 1940 1950 1960…
A: Let x represents the year since 1920 and y represents the life expectancy at birth. Rewrite the…
Q: OClal SthZ.2.30 U Full data set p The table to right gives the projections of the population of a…
A: Here population of country from 2000 to 2100 is given.We have to find here linear function.Let…
Q: What are the blanks?
A: (a).Use the online graphing calculator and plot the points as shown below.
Q: Quarterly demand for Mercedes automobiles in Turkey has been given below. Calculate the MSE of…
A: Find the 2-period Weighted Moving Averages for the given data: Given data represents the Quarterly…
Q: 330 330 325 325 320 320 315 315 310 310 305 305 10 11 12 13 14 15 6. 10 Use the slope of each line…
A:
Q: Rates: 1960 to 2014 20 10 14. 12 US Peverty Rate ie 2 12IN Real cOP Pe Capita Dec 31 1975 SAAO Dec…
A: The graph shown above is declining gradually from year 1960-1975, After that the line increased up…
Q: Anita Limited has shared their annual sales revenue over the last 6 financial years from 2015 to…
A: For Using linear trend equation to forecast the sales revenue of Anita Limited for 2021, we have to…
Q: Review 1. The table shows the highest maximum temperature for the month of October in Philadelphia,…
A: we know that the highest maximum temperature depends on the year. So, Independent variable is year…
Q: The unemployment rate U(t) varies with time. The table gives the percentage of unemployed in a…
A: To construct a table of values for U'(t).
Q: The table gives the projections of the population, in millions, of a country's residents over age 16…
A: please find the answer.
Q: Consider the following quarterly demand level for electricity (in 1000 megawatts) in Mankweng from…
A: Given, Quarterly demand level of electricity is given in below table: Year /…
Q: Consider the following quarterly demand level for electricity (in 1000 megawatts) in Mankweng from…
A: Hello! As you have posted more than 3 sub parts, we are answering the first 3 sub-parts. In case…
Q: Years I 2005 2006 2007 Quarterly II 65 78 68 70 80 70 60 75 75 determine the seasonal pattern with…
A: Seasonal variations are those variations that tend to repeat themselves over a period of time…
Q: The following are historical demand data: YEAR SEASON ACTUAL DEMAND 2 years ago Spring 205…
A: Solution: The historical demand data is given. It is asked to use the regression analysis on…
Q: a. Plot the time series. b. Fit a three-year moving average to the data and plot the results. c.…
A: Here, we have a time series data from 2000 to 2016. The data gives measurement of shipment of…
Q: Snow on the Ground (Inches) 2. 9, of 6. 18 17 16 15 14 13 12 11 10 9. 8 7. 4 1 6. 10 11 12 13 14 15…
A:
Q: Daily demand for marigold flowers at a large garden store is shown below. Compute:a. A three-period…
A: The Moving Average Forecasts so you can get a better understanding of the outcome that will be…
Q: From March to April * anuary February March April May Remain steady Dramatical rise June Appr August…
A: We want to find correct answer.
Q: Fit a parabolic trend to the following tome - series data and estimate the production in 2022. Year…
A: Ans . The equation is y=a+bx+cx2 and the normal equations are ∑y=an+b∑x+c∑x2…
Q: Below is data collected over 6 specific years. The data collected is the Consumer Price Index (CPI)…
A: Note: Since you have posted a question with multiple subparts, we will solve the first three…
Q: For the data set, perform a 3 month moving average to determine the forecast for month 13. Show all…
A: From the given information, thirteen months rate was given. The forecasted value of month 13 is need…
Q: e table shows the percentage Pof an employee's annual salary S, in thousands of dollars, spent on…
A: Hello! As you have posted more than 3 sub parts, we are answering the first 3 sub-parts. In case…
Q: Given the number of calls per week received by a dental clinic, what is the forecasted number of…
A: Given the number of calls per week received by a dental clinic. The forecasted number of calls for…
Q: Unemployment rate versus Inflation rate 2007 2008 2009 2010 2011 2012 2013 2014 2015 2016 2017…
A: Hello. Since your question has multiple parts, we will solve first question for you. If you want…
Q: Percent of 16-Year-Olds with Driver's Licenses Find the average rate of change for the three Average…
A: Given query is to find the average rate of change for different years.
Q: Table #2.3.7 contains the value of the house and the amount of rental income in a year that the…
A: There are various types of graphs that are constructed for quantitative variables. One of the widely…
Q: During a snowstorm, snow fell at a constant rate for a number of hours. Then it stopped snowing for…
A: To find the rate, we have to find the slope of the curve from t = 0 to 4. Let y = snow on the…
Q: A scientist believes that, over the years, the number of major earthquakes has been decreasing. To…
A: The given bivariate data was represented graphically, which is otherwise regarded as scatter…
Q: 5. The scatter plot below suggests a linear relationship between time spent studying and the grade…
A: From the graph the line intercepts y-axis At 50%
Q: The data in the accompanying table represent the rate of return of a certain company stock for 11…
A: Hello! As you have posted more than 3 sub parts, we are answering the first 3 sub-parts. In case…
Q: Month Temperature Rain Humidity Jan 10.5mm 87% 1 C° 5 C° FEB 10.2mm 81% Mars 12.2mm 72% April 11 C…
A: Given the data on temperature, average rainfall and humidity.
Q: 3-period moving average Answer is not complete. Absolute Day Demand (t) Forecast (t) Error (t) 154…
A: 3 period moving average

Step by step
Solved in 2 steps

- Verify that the 5 year weighted moving average weight 1, 2, 2, 1 respectively is equivalent to 4 year centered moving average. Year 1994 1995 1996 1997 1998 1999 2000 2001 2002 2003 2004 Sales(K) 5 3 7 6 4 8 9 10 8 9 9A manufacturer of cases for sound equipment requires drilling holes for metal screws. The drill bits wear out and must be replaced; there is expense not only in the cost of the bits but also for lost production. Engineers varied the rotation speed of the drill and measured the life- time y of four bits at each of five speeds. Speed Lifetime 60 4.6 60 3.8 60 4.9 60 4.5 80 4.7 80 5.8 80 5.5 80 5.4 100 5 100 4.5 100 3.2 100 4.8 120 4.1 120 4.5 120 4 120 3.8 140 3.6 140 3 140 3.5 140 3.4 Create a scatterplot of the data. Does there appear to be a relation? Does it appear to be linear? Regardless fit a simple linear regression model to the data. What can you say about the fit of the model to the data? Is there any evident outlier . Remove this observation and fit the regression model again. Is it improving the model fAccording to published reports, practice under fatigued conditions distorts mechanisms that govern performance. An experiment was conducted using 15 college males, who were trained to make a continuous horizontal right-to-left arm movement from a microswitch to a barrier, knocking over the barrier coincident with the arrival of a clock sweephand to the 6 o’clock position. The absolute value of the difference between the time, in milliseconds, that it took to knock over the barrier and the time for the sweephand to reach the 6 o’clock position (500 msec) was recorded. Each participant performed the task five times under prefatigue and postfatigue conditions, and the sums of the absolute differences for the five performances were recorded. An increase in the mean absolute time difference when the task is performed under postfatigue conditions would support the claim that practice under fatigued conditions distorts mechanisms that govern performance. Assuming the populations to be…
- Observations of the demand for a certain part stocked at a parts supply depot during the calendaryear 2013 were: Month Demand Month Demand Jan 89 july 223 Feb 57 august 286 mar 144 sept 212 april 221 oct 275 may 177 nov 188 june 280 dec 312 a) Using a four-month moving average, determine the one-step-ahead forecast for Julythrough December 2013.b) Using a four-month moving average, determine the two-step-ahead forecast for Julythrough December 2013.c) Obtain the MAD for the forecasts obtained in the above sections. Which method gavebetter results? Based on forecasting theory, which method should have given betterresults?b) What is the maximum height of the shot-put’s trajectory and at what time does it get there?The prices (in $) of Rawlston, Inc. stock ( y) over a period of 12 days, the number of shares (in 100s) of company's stocks sold ( x 1), and the volume of exchange (in millions) on the New York Stock Exchange ( x 2) are shown below. Day (y) (x1) (x2) 1 87.50 950 11.00 2 86.00 945 11.25 3 84.00 940 11.75 4 83.00 930 11.75 5 84.50 935 12.00 6 84.00 935 13.00 7 82.00 932 13.25 8 80.00 938 14.50 9 78.50 925 15.00 10 79.00 900 16.50 11 77.00 875 17.00 12 77.50 870 17.50 Excel was used to determine the least squares regression equation. Part of the computer output is shown below. ANOVA df SS MS F Significance F Regression 2 118.8474 59.4237 40.9216 0.0000 Residual 9 13.0692 1.4521 Total 11 131.9167 Coefficients Standard Error t Stat P-value Intercept…
- The following table gives the millions of metric tons of carbon dioxide emissions in a certain country for selected years from 2010 and projected to 2032. Year 2010 2012 2014 2016 2018 2020 CO2 Emissions 337.5 361.5 395.1 425.8 451.1 496.4 Year 2022 2024 2026 2028 2030 2032 CO2 Emissions 558.2 592.9 628.7 662.1 709.1 742.7 (a) Create a linear function that models these data, with x as the number of years past 2010 and y as the millions of metric tons of carbon dioxide emissions. (Round all numerical values to two decimal places.)y(x) = (b) Find the model's estimate for the 2028 data point. (Round your answer to two decimal places.) million metric tons(c) Find the slope of the linear model. (Round your answer to two decimal places.)Interpret the slope of the linear model. For each year since ---Select--- 2009 2010 2015 2028 2032 , carbon dioxide emissions in the U.S. are expected to change by million metric tons.Find the orthogonal trajectories of the family of circles passing through the points (1, −2) and (1, 2).A rocket will carry a communications satellite into low Earth orbit. Suppose that the thrust during the first 200 sec of flight is provided by solid rocket boosters at different points during liftoff. The graph shows the acceleration in G–forces (that is, acceleration in 9.8 – /msec2 increments) versus time after launch.
- A manufacturing firm, Caleb Corp, produces and sells product in its home (US) market, and in a foreign market. There is inherent risk in the revenues collected from the foreign market due to volatility in the exchange rate. Under a benchmark strategy, all of the production takes place in the home country. The resulting expected profits for Caleb Corp are variable, due to variation in the exchange rate. As an approximation, the firm has estimated profits for five possible ranges of the exchange rate, with profit represented as a lottery, L= (.2, 150; .2, 200; .3, 220; .2,250; .1, 270) The probabilities are estimated probabilities for the different ranges. The outcomes in this lottery are the estimated final profit levels (not changes in profit). (a) Calculate the expected profit if the firm follows this benchmark strategy, i.e., E(L)A manufacturing firm, Caleb Corp, produces and sells product in its home (US) market, and in a foreign market. There is inherent risk in the revenues collected from the foreign market due to volatility in the exchange rate. Under a benchmark strategy, all of the production takes place in the home country. The resulting expected profits for Caleb Corp are variable, due to variation in the exchange rate. As an approximation, the firm has estimated profits for five possible ranges of the exchange rate, with profit represented as a lottery, L= (.2, 150; .2, 200; .3, 220; .2,250; .1, 270) The probabilities are estimated probabilities for the different ranges. The outcomes in this lottery are the estimated final profit levels (not changes in profit). Now suppose the firm can also buy forward contracts on foreign currency to neutralize the effect of the exchange rate on profits. Assume that these provide complete hedging, but that it involves an additional cost, so that following the…Use the data to model deliveries times for a driver based on three parameters. If today's delivery routs requires 42 miles, 8.3 gallons of gas, and has 4 deliveries, how much time should the driver expect to be on the road? (Keep one decimal place) Assignment Miles Gasoline Consumption Deliveries Time 1 100.0 10.0 4.0 9.3 2 50.0 6.2 3.0 4.8 3 100.0 9.5 4.0 8.9 4 100.0 10.3 2.0 6.5 5 50.0 4.7 2.0 4.2 6 80.0 7.8 2.0 6.2 7 75.0 7.7 3.0 7.4 8 65.0 6.4 4.0 6.0 9 90.0 8.8 3.0 7.6 10 90.0 10.0 2.0 6.1 11 50.0 5.0 5.0 7.0 12 45.0 4.9 6.0 7.0 13 85.0 8.1 5.0 9.6 14 65.0 6.6 2.0 6.5 15 40.0 4.0 6.0 7.2 16 50.0 5.5 3.0 6.0 17 75.0 7.4 5.0 9.9 18 75.0 7.6 4.0 8.6 19 65.0 6.8 3.0 4.9 20 90.0 8.4 3.0 7.5 21 95.0 8.8 1.0 7.2 22 95.0 10.2 6.0 9.9 23 50.0 4.6 1.0 5.6 24 80.0 8.6 3.0 7.5 25 90.0 8.6 2.0 7.8 26 80.0 8.8 3.0 7.2 27 75.0 6.9 3.0 7.0 28 95.0 10.0 2.0 8.7 29 90.0 9.2 1.0 6.4 30 100.0 9.4 3.0 9.9 31 60.0 6.0 1.0 4.1 32 90.0…
