Consider the reaction data. A products T (K) (s- 325 0.376 875 0.719 What two points should be plotted to graphically determine the activation energy of this reaction? To avoid rounding errors, use at least three significant figures in all values. x1 = yI = x2 = y2 = Determine the rise, run, and slope of the line formed by these points. rise: run: slope: What is the activation energy of this reaction?
Consider the reaction data. A products T (K) (s- 325 0.376 875 0.719 What two points should be plotted to graphically determine the activation energy of this reaction? To avoid rounding errors, use at least three significant figures in all values. x1 = yI = x2 = y2 = Determine the rise, run, and slope of the line formed by these points. rise: run: slope: What is the activation energy of this reaction?

Chapter4: Least-squares And Calibration Methods
Section: Chapter Questions
Problem 6P

Related questions
Question
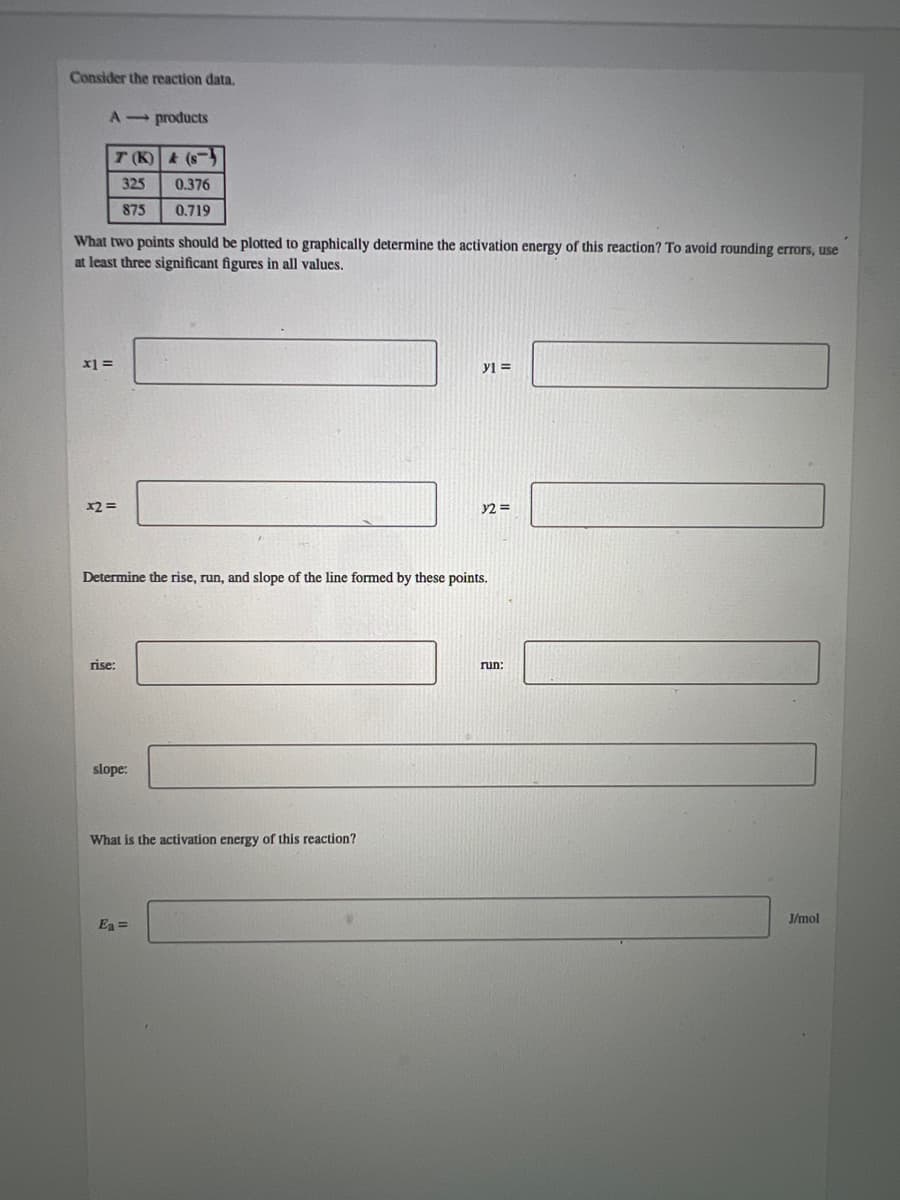
Transcribed Image Text:Consider the reaction data.
A-products
T (K)& (s-
325
0.376
875
0.719
What two points should be plotted to graphically determine the activation energy of this reaction? To avoid rounding errors, use
at least three significant figures in all values.
yi =
X2 =
Determine the rise, run, and slope of the line formed by these points.
rise:
run:
slope:
What is the activation energy of this reaction?
J/mol
Ea =
Expert Solution
This question has been solved!
Explore an expertly crafted, step-by-step solution for a thorough understanding of key concepts.

This is a popular solution!

Trending now
This is a popular solution!

Step by step
Solved in 3 steps with 3 images

Knowledge Booster


Learn more about
Need a deep-dive on the concept behind this application? Look no further. Learn more about this topic, chemistry and related others by exploring similar questions and additional content below.Recommended textbooks for you

Physical Chemistry
Chemistry
ISBN:
9781133958437
Author:
Ball, David W. (david Warren), BAER, Tomas
Publisher:
Wadsworth Cengage Learning,
Physical Chemistry
Chemistry
ISBN:
9781133958437
Author:
Ball, David W. (david Warren), BAER, Tomas
Publisher:
Wadsworth Cengage Learning,