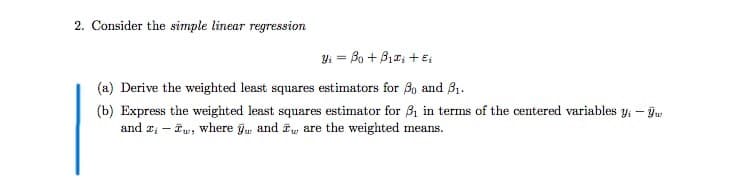
Consider the simple linear regression Y: = Bo + B1a, +E, (a) Derive the weighted least squares estimators for 3, and B1. (b) Express the weighted least squares estimator for B1 in terms of the centered variables y, - Ju and z, – Fw, where gu, and fu are the weighted means.


Q: A 1992 article in the Journal of the American Medical Association ("A Critical Appraisal of 98.6…
A: From the given data we get x bar = 98.292 s = 0.468970504 n =25 alpha= 0.05
Q: Steve Burns, host of the first season of Blue' clues recently bids goodbye to the show. Assuming…
A:
Q: Temperature (°F) 50-59 60-69 70-79 80-89 90-99 100-109 Days 305 1448 1509 346 14 (a) Approximate the…
A: Temperatures (class) :- 50-59, 60-60, 70-79, 80-89, 90-99, 100-109 Days (frequency) :- 5, 305, 1448,…
Q: c. Using Statkey or another tool find the p-value. d. Are the results statistically significant? Why…
A: Followings are the Explanation of the question Use the excel and calculate the Sample Mean and…
Q: Consider a population consisting of the following five values, which represent the number of DVD…
A: Disclaimer : “Since you have posted a question with multiple sub-parts, we will solve first three…
Q: Many college and university students obtain summer jobs. A professor wanted to determine whether…
A:
Q: A population is known to have a right-skewed distributions with mean 10, median 6.931, and standard…
A: Given that A population is known to have a right-skewed distributions with mean 10, median 6.931,…
Q: "Nothing succeeds like success" is an old adage in the advertising business. The president of a…
A: Given information: Last year's Bonus This Year's Sales 7.8 64 6.9 73 6.7 42 6 49 6.9 71…
Q: (a) There are 97% of the cars will be loaded with more than K tons of coal. What is the value of K?…
A: here AS PER GUIDELINES I HAVE CALCULATED 3 SUBPARTS Coal is carried from a mine in West Virginia to…
Q: 3. A researcher estimates that the average height of buildings in terms of the number of storey in…
A: Population mean μ=15, Note: According to Bartleby guidelines expert solve only one question and…
Q: Find the critical value za12 that corresponds to a= 0.08. Ζα /2 (Round to two decimal places as…
A: Givenα=0.08
Q: What must be the upper limit of the interval (5, x ), for learners who experienced an internet…
A: For defining the appropriate upper limit, with the available information of s (sample standard…
Q: A claim by a researcher stated that the time spent on the internet per week is greater than 15 nours…
A: We have given that, H1 > 15 Sample size (n) = 150 and statistic = 2.26 Then, We will find p-…
Q: A genetic experiment with peas resulted in one sample of offspring that consisted of 447 green peas…
A: Given that The 95% confidence interval is calculated as
Q: Computer technology has produced an environment in which robots operate with the use of…
A: Given,p=0.1q=1-0.1=0.9A random variable X~Geometric(p=0.1)P(X=x)=0.10.9x ; x=0,1,2,3,.....
Q: You generate a scatter plot using Excel. You then have Excel plot the trend line and report the…
A: The regression equation is reported as y=−87.92x+95.31 r2=0.04
Q: Find the future value of an annuity of $1500 paid at the end of each year for 10 years, if interest…
A: Given that $1500 paid at the end of each year for 10 years, if interest is earned at a rate of 7%,…
Q: The following table presents the intelligence quotients of nunaway boys. Intelligence Quotient 30 -…
A: From the above data The third option is correct The data is normally distributed The second option…
Q: Given that X is a continuous random variable that has a uniform probability distribution, and 2.5 <…
A:
Q: The Production manager of GTW Manufacturing Company inspected that out of 20 bags of biscuits, there…
A:
Q: Using the same sample data to compute each of the listed confidence intervals, which one of the…
A: We have given that the statement about to the confidence interval.
Q: Calculate the following probabilities and indicate which probability distribution model is…
A:
Q: The following table presents the intelligence quotients of runaway boys. Intelligence Quotient 30 -…
A:
Q: (1 point) Let L equal the number of coin flips up to and including the first flip of heads. Devise a…
A:
Q: 10. A bowl contains 10 marbles: 3 red marbles, 5 blue marbles, and 2 white marbles. Three marbles…
A:
Q: The line of best fit through a set of data isy=−46.504−3.821xy=-46.504-3.821x According to this…
A: Given equation is y=-46.504-3.821x
Q: e. Find the standard deviation of the random variable X.
A: A random Sample of 200 residents; n=200 p=0.254
Q: . The distribution of passenger vehicle speeds traveling on the Interstate 5 Freeway (I-5) in…
A: Given that The distribution of passenger vehicle speeds traveling on the Interstate 5 Freeway (I-5)…
Q: 5. The position x of an object as a function of time t. Time, t (s) Distance, x (m) 5.0 -225 1.0 2.0…
A: Given that, The position x of an object as a function of time t. The table is given below for time…
Q: Dixie Showtime Movie Theaters, Inc., owns and operates a chain of cinemas in several markets in the…
A: Given data indicates weekly gross revenue as a function of advertising expenditures for a sample of…
Q: Using your favorite statistics software package, you generate a scatter plot with a regression…
A: Given that
Q: what Dr. Hafen’s null hypothesis would be and what Dr. Hafen’s alternative hypothesis would be. If…
A: Dr. Hafen is doing research on the effects of study time (how many minutes students study) on test…
Q: 3) A board of directors composed of eight people must select board officers. In how many ways can a…
A: Given that n =8,r =3 using permutations
Q: The table shows the total assets (in trillions) held in a foreign bank for the given years. Complete…
A: Let t=0 for 2000, t=5 for 2005, t=7 for 2007, t=9 for 2009, t=11 for 2011, t=13 for 2013 and t=15…
Q: MO22. A textile fiber manufacturer is investigating a new drapery yarn, which the company claims has…
A: Given that Hypothesized Population Mean (\mu)(μ) = 1212 Population Standard Deviation…
Q: LetX∼N(7,4). (a) Find P(6 < X ≤ 10). (b) Find ξ so that P(6 < X < ξ) = 0.1716.
A: The following information has been given: A random variable X follows normal distribution with mean…
Q: MO21. A civil engineer is analyzing the compressive strength of concrete. Compressive strength is…
A:
Q: The mean grade on a final examination was 72 and the standard deviation was 9. The top 10% of the…
A: Mean(µ) = 72Standard deviations (σ) = 9
Q: Salaries of 36 college graduates who took a statistics course in college have a mean, x, of $62,700.…
A: We have given that, Sample mean (x̄) = 62700, population standard deviation (σ) = 16957 and sample…
Q: 1. A report in LTO stated that the average age of taxis in the Philippines is 9 years. An operations…
A:
Q: For independent events A and B , P(A)=0.80 and P(B)=0.20, Find P(A∩B) a. 1/2 b. 1/4 c. 16/25 d.…
A: Two events A and B are given.
Q: Choose the most appropriate statistical analysis for an experiment where 2 different groups of…
A: Statistical Test A statistical test is a method that allows us to make empirical conclusions about a…
Q: The yield of a chemical process is being studied. From previous experience yield is known to be…
A:
Q: The following standardization data were provided for a series of external standards of Cd²+ that had…
A: a) Regression Equation: Excel Procedure: Enter Cd2+ and Smeas and Y data in Excel Go to Data Click…
Q: On December 17, 2007 baseball writer John Hickey wrote an article for the Seattle P-I about…
A: The following information has been given: X(price) Y(wins) 19.68 90 17.07 84 34.3 85 17.9…
Q: MO22. A textile fiber manufacturer is investigating a new drapery yarn, which the company claims has…
A:
Q: b) Assume that a recent survey suggests that about 87% of computers use a new operating system.…
A: Given: Margin of error , E=0.01 p^=0.87
Q: The data shows the scores of 8 employees in an admission test and their academic performance. 1.…
A: Given data is
Q: sample of 624 applicants to the Durmstrang Institute of Sorcery, 133 were accepted. Construct a 90%…
A: Given that X=133 , n=624 , p=20%=0.20
Q: Answer must be a fraction in lowest term. * The probability distribution of the discrete random…
A:


Trending now
This is a popular solution!

Step by step
Solved in 2 steps with 4 images

- A “Cobb–Douglas” production function relates production (Q) to factorsof production, capital (K), labor (L), and raw materials (M), and an errorterm u using the equation Q = λKβ1Lβ2Mβ3eu, where λ, β1, β2, and β3 areproduction parameters. Suppose that you have data on production and thefactors of production from a random sample of firms with the same Cobb–Douglas production function. How would you use regression analysis toestimate the production parameters?Which of the following are feasible equations of a least squares regression line for the annual population change of a small country from the year 2000 to the year 2015? Select all that apply. Select all that apply: yˆ=38,000+2500x yˆ=38,000−3500x yˆ=−38,000+2500x yˆ=38,000−1500x8)Suppose that Y is normal and we have three explanatory unknowns which are also normal, and we have an independent random sample of 11 members of the population, where for each member, the value of Y as well as the values of the three explanatory unknowns were observed. The data is entered into a computer using linear regression software and the output summary tells us that R-square is 0.86, the linear model coefficient of the first explanatory unknown is 7 with standard error estimate 2.5, the coefficient for the second explanatory unknown is 11 with standard error 2, and the coefficient for the third explanatory unknown is 15 with standard error 4. The regression intercept is reported as 28. The sum of squares in regression (SSR) is reported as 86000 and the sum of squared errors (SSE) is 14000. From this information, what is MSE/MST? .5000 NONE OF THE OTHERS .2000 .3000 .4000
- 9)Suppose that Y is normal and we have three explanatory unknowns which are also normal, and we have an independent random sample of 11 members of the population, where for each member, the value of Y as well as the values of the three explanatory unknowns were observed. The data is entered into a computer using linear regression software and the output summary tells us that R-square is 0.79, the linear model coefficient of the first explanatory unknown is 7 with standard error estimate 2.5, the coefficient for the second explanatory unknown is 11 with standard error 2, and the coefficient for the third explanatory unknown is 15 with standard error 4. The regression intercept is reported as 28. The sum of squares in regression (SSR) is reported as 79000 and the sum of squared errors (SSE) is 21000. From this information, what is the adjusted R-square? .8 .7 NONE OF THE OTHERS .6 .5A set of paired data has a least squares regressionline with equation yn = 0.50x + 2.0 and a correlationcoefficient of r = 0.80. Suppose we convert the datafor each variable to z-scores and then compute the newregression line. What will the equation be?A) zˆy = 0.50zx B) zˆy = 0.64zxC) zˆy = 0.80zx D) zˆy = 0.50zx + 20E) zˆy = 0.80zx + 2017) Suppose that Y is normal and we have three explanatory unknowns which are also normal, and we have an independent random sample of 41 members of the population, where for each member, the value of Y as well as the values of the three explanatory unknowns were observed. The data is entered into a computer using linear regression software and the output summary tells us that R-square is 0.9, the linear model coefficient of the first explanatory unknown is 7 with standard error estimate 2.5, the coefficient for the second explanatory unknown is 11 with standard error 2, and the coefficient for the third explanatory unknown is 15 with standard error 4. The regression intercept is reported as 28. The sum of squares in regression (SSR) is reported as 90000 and the sum of squared errors (SSE) is 10000. From this information, what is the number of degrees of freedom for the t-distribution used to compute critical values for hypothesis tests and confidence intervals for the individual…
- Consider the fitted values from a simple linear regression model with intercept: yˆ = 5 + 6x. Assume that the total number of observations is n = 302. In addition, the R-squared of the regression is R2 = 0.6 and Pn i=1(xi − x¯) 2 = 15, where ¯x is the sample mean of x. Under the classical Gauss-Markov assumptions, a) What is the standard error of the estimated slope coefficient?Consider the following population model for household consumption: cons = a + b1 * inc+ b2 * educ+ b3 * hhsize + u where cons is consumption, inc is income, educ is the education level of household head, hhsize is the size of a household. Suppose a researcher estimates the model and gets the predicted value, cons_hat, and then runs a regression of cons_hat on educ, inc, and hhsize. Which of the following choice is correct and please explain why. A) be certain that R^2 = 1 B) be certain that R^2 = 0 C) be certain that R^2 is less than 1 but greater than 0. D) not be certainA researcher collected data on the cholesterol level, CC, and the age, AA, of 24 people selected at random. Using the data, the researcher calculated the least-squares regression line to be Cˆ=182+2.2AC^=182+2.2A and the standard error of the slope to be 0.38. If the conditions for inference are met, which of the following is closest to the value of the test statistic to test the hypotheses H0:β=0H0:β=0 versus Ha:β≠0Ha:β≠0 ?
- In a study measuring the relationship between height in centimeters and annual income in dollars, it has been determined that for Group 1, r2 =0.15 and for Group 2, r2 =0.10 where r denotes the correlation between the two variables. Least-squares regression lines are fitted to the observations from each group. Which of the following statement is true: A. There could be a positive relationship between the two variables for Group 1 and a negative relationship between the two variables for Group 2 B. The sum of the residuals for Group 1 is greater than the sum of the residuals for Group 2. C. Measuring the height in inches would increase the value of r2 for both groups. D. None of the answer options is true Can you also explain the difference between r and r2, and why least square regressions are used?Find the least-squares regression line y^ =b0+b1xy^=b0+b1x through the points (−3,1),(1,8),(6,13),(7,18),(12,27). For what value of is y^ =0? x =?Consider the following regression model Yt = β0 + β1 Ut + β2 Vt + β3 Wt + β4Xt + ∈t , where U, V, W, X and Y are economic variables observed from t = 1, . . . , 75, β0 , . . . , β4 are the model parameters and ∈t is the random disturbance term satisfying the classical assumptions. Ordinary Least Squares (OLS) is used to estimate the parameters, producing the following estimated model: Yt = 1.115 + 0.790*Ut − 0.327*Vt + 0.763*Wt + 0.456*Xt (0.405) (0.178) (0.088) (0.274) (0.017) where standard errors are given in parentheses, the R-squared = 0.941, the Durbin-Watson statistic is DW = 1.907 and the residual sum of squares is RSS = 0.0757. In answering this question, use the 5% level of significance for any hypothesis tests that you are asked to perform, state clearly the null and al- ternative hypotheses that you are testing, the test statistics that you are using and interpret the decisions that you make.…

