Consider two states that adopt different laws concerning labor unions. The following graph shows the labor market in a state in the North. Initially, the market-clearing wage there is $8.00 per hour. Suppose that the legislature in this northern state passes laws that make it easy for workers to join a union. Through collective bargaining, the union negotiates a wage of $10.00 per hour. Use the graph input tool to help you answer the following questions. You will not be graded on any changes you make to this graph. 020040060080010001200140016001614121086420WAGE (Dollars per hour)LABOR (Thousands of workers)Demand Supply Graph Input Tool Market for Labor Wage (Dollars per hour) Labor Demanded (Thousands of workers) Labor Supplied (Thousands of workers) Enter $10.00 into the box labeled Wage on the previous graph. Hint: Be sure to pay attention to the units used on the graph. At the union wage, union workers will be employed. The following graph shows the labor market in a state in the South. The legislature in this state passes strong "right-to-work" laws that make it very difficult for unions to organize workers, so the wage is always equal to the market-clearing value. Except for this difference in legislation, the two states are very similar. The initial position of the graph corresponds to the initial labor market condition in the southern state before the labor union negotiated the new, higher wage for workers in the northern state. Suppose that after the wage goes up in the northern state, some workers in the northern state lose their jobs and decide to move to the southern state. Adjust the graph to show what happens to employment and wages in the southern state. DemandSupplyWAGELABORDemand Supply Which of the following groups are worse off as a result of the union action in the northern state? Check all that apply. The original workers in the southern state Employers in the northern state All workers in the northern state Workers in the northern state employed at the union wage
Consider two states that adopt different laws concerning labor unions. The following graph shows the labor market in a state in the North. Initially, the market-clearing wage there is $8.00 per hour. Suppose that the legislature in this northern state passes laws that make it easy for workers to join a union. Through collective bargaining, the union negotiates a wage of $10.00 per hour. Use the graph input tool to help you answer the following questions. You will not be graded on any changes you make to this graph. 020040060080010001200140016001614121086420WAGE (Dollars per hour)LABOR (Thousands of workers)Demand Supply Graph Input Tool Market for Labor Wage (Dollars per hour) Labor Demanded (Thousands of workers) Labor Supplied (Thousands of workers) Enter $10.00 into the box labeled Wage on the previous graph. Hint: Be sure to pay attention to the units used on the graph. At the union wage, union workers will be employed. The following graph shows the labor market in a state in the South. The legislature in this state passes strong "right-to-work" laws that make it very difficult for unions to organize workers, so the wage is always equal to the market-clearing value. Except for this difference in legislation, the two states are very similar. The initial position of the graph corresponds to the initial labor market condition in the southern state before the labor union negotiated the new, higher wage for workers in the northern state. Suppose that after the wage goes up in the northern state, some workers in the northern state lose their jobs and decide to move to the southern state. Adjust the graph to show what happens to employment and wages in the southern state. DemandSupplyWAGELABORDemand Supply Which of the following groups are worse off as a result of the union action in the northern state? Check all that apply. The original workers in the southern state Employers in the northern state All workers in the northern state Workers in the northern state employed at the union wage

Managerial Economics: A Problem Solving Approach
5th Edition
ISBN:9781337106665
Author:Luke M. Froeb, Brian T. McCann, Michael R. Ward, Mike Shor
Publisher:Luke M. Froeb, Brian T. McCann, Michael R. Ward, Mike Shor
Chapter2: The One Lesson Of Business
Section: Chapter Questions
Problem 2.4IP

Related questions
Question
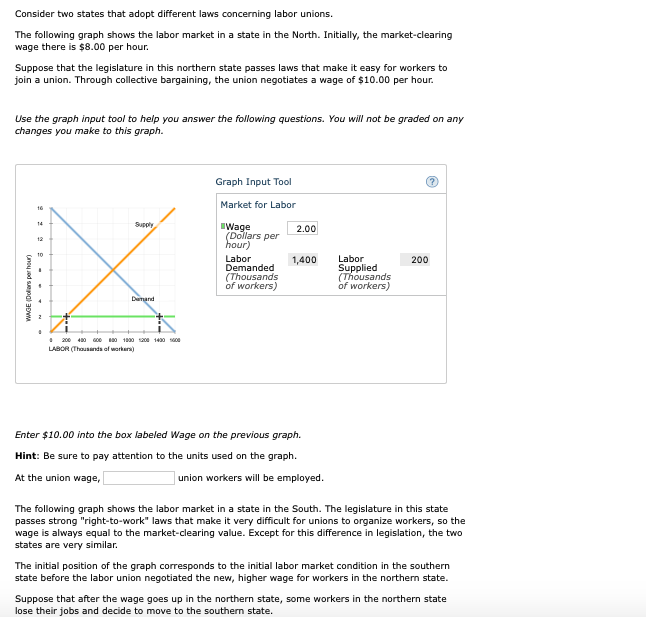
Consider two states that adopt different laws concerning labor unions.
The following graph shows the labor market in a state in the North. Initially, the market-clearing wage there is $8.00 per hour.
Suppose that the legislature in this northern state passes laws that make it easy for workers to join a union. Through collective bargaining, the union negotiates a wage of $10.00 per hour.
Use the graph input tool to help you answer the following questions. You will not be graded on any changes you make to this graph.
020040060080010001200140016001614121086420WAGE (Dollars per hour)LABOR (Thousands of workers)Demand Supply
Graph Input Tool
|
Market for Labor
|
|||||
|---|---|---|---|---|---|
|
Wage
(Dollars per hour)
|
|
||||
|
Labor Demanded
(Thousands of workers)
|
|
Labor Supplied
(Thousands of workers)
|
Enter $10.00 into the box labeled Wage on the previous graph.
Hint: Be sure to pay attention to the units used on the graph.
At the union wage,
union workers will be employed.
The following graph shows the labor market in a state in the South. The legislature in this state passes strong "right-to-work" laws that make it very difficult for unions to organize workers, so the wage is always equal to the market-clearing value. Except for this difference in legislation, the two states are very similar.
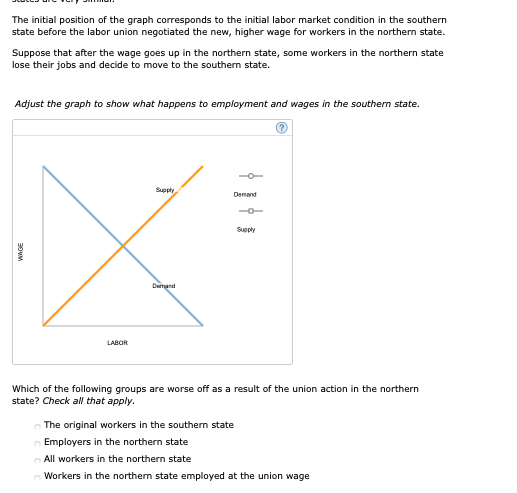
The initial position of the graph corresponds to the initial labor market condition in the southern state before the labor union negotiated the new, higher wage for workers in the northern state.
Suppose that after the wage goes up in the northern state, some workers in the northern state lose their jobs and decide to move to the southern state.
Adjust the graph to show what happens to employment and wages in the southern state.
DemandSupplyWAGELABORDemand Supply
Which of the following groups are worse off as a result of the union action in the northern state? Check all that apply.
The original workers in the southern state
Employers in the northern state
All workers in the northern state
Workers in the northern state employed at the union wage
|
Transcribed Image Text:The initial position of the graph corresponds to the initial labor market condition in the southern
state before the labor union negotiated the new, higher wage for workers in the northern state.
Suppose that after the wage goes up in the northern state, some workers in the northern state
lose their jobs and decide to move to the southern state.
Adjust the graph to show what happens to employment and wages in the southern state.
-O-
Supply
Demand
Supply
Demand
LABOR
Which of the following groups are worse off as a result of the union action in the northern
state? Check all that apply.
The original workers in the southern state
Employers in the northern state
All workers in the northern state
Workers in the northern state employed at the union wage
Transcribed Image Text:Consider two states that adopt different laws concerning labor unions.
The following graph shows the labor market in a state in the North. Initially, the market-clearing
wage there is $8.00 per hour.
Suppose that the legislature in this northern state passes laws that make it easy for workers to
join a union. Through collective bargaining, the union negotiates a wage of $10.00 per hour.
Use the graph input tool to help you answer the following questions. You will not be graded on any
changes you make to this graph.
Graph Input Tool
Market for Labor
16
14
Addng
IWage
(Dollars per
hour)
2.00
12
10
Labor
Demanded
(Thousands
of workers)
1,400
Labor
200
Supplied
(Thousands
of workers)
Demand
200 480 00 0 1800 0e 140 e
LABOR (Thousanda of workars)
Enter $10.00 into the box labeled Wage on the previous graph.
Hint: Be sure to pay attention to the units used on the graph.
At the union wage,
|union workers will be employed.
The following graph shows the labor market in a state in the South. The legislature in this state
passes strong "right-to-work" laws that make it very difficult for unions to organize workers, so the
wage is always equal to the market-clearing value. Except for this difference in legislation, the two
states are very similar.
The initial position of the graph corresponds to the initial labor market condition in the southern
state before the labor union negotiated the new, higher wage for workers in the northern state.
Suppose that after the wage goes up in the northern state, some workers in the northern state
lose their jobs and decide to move to the southern state.
(noy ed seogl apw
Expert Solution
This question has been solved!
Explore an expertly crafted, step-by-step solution for a thorough understanding of key concepts.

This is a popular solution!

Trending now
This is a popular solution!

Step by step
Solved in 2 steps with 2 images

Knowledge Booster


Learn more about
Need a deep-dive on the concept behind this application? Look no further. Learn more about this topic, economics and related others by exploring similar questions and additional content below.Recommended textbooks for you
Managerial Economics: A Problem Solving Approach
Economics
ISBN:
9781337106665
Author:
Luke M. Froeb, Brian T. McCann, Michael R. Ward, Mike Shor
Publisher:
Cengage Learning


Managerial Economics: A Problem Solving Approach
Economics
ISBN:
9781337106665
Author:
Luke M. Froeb, Brian T. McCann, Michael R. Ward, Mike Shor
Publisher:
Cengage Learning


Microeconomics: Private and Public Choice (MindTa…
Economics
ISBN:
9781305506893
Author:
James D. Gwartney, Richard L. Stroup, Russell S. Sobel, David A. Macpherson
Publisher:
Cengage Learning

Economics: Private and Public Choice (MindTap Cou…
Economics
ISBN:
9781305506725
Author:
James D. Gwartney, Richard L. Stroup, Russell S. Sobel, David A. Macpherson
Publisher:
Cengage Learning