Construct a boxplot, by hand, for each vector. a.) M<-c(30, 2, 10, 200, 1, 80, 40, 30, 40, 35, 55) b.) S<-c(100, 52,45,36,30,-7,0, 35, 30, 40, 50, 45, 85, 84, 52, 1, 28, 30) Step 1: Write R code that would make vertical boxplots for M and S, from question 1, on the same plot with the following features: main title labeled as "Two Boxplots for Comparison_Put_Your_Name_here", names the M boxplot as "Boxplot for M", names the S boxplot as "Boxplot for S", colors the M Boxplot red and the S boxplot green. Step 2: Go to RRS and run your R code. Step 3: Submit your R code and boxplots from the R output(you can submit screenshots of your R code and boxplots or you can use a google doc).
Construct a boxplot, by hand, for each vector. a.) M<-c(30, 2, 10, 200, 1, 80, 40, 30, 40, 35, 55) b.) S<-c(100, 52,45,36,30,-7,0, 35, 30, 40, 50, 45, 85, 84, 52, 1, 28, 30) Step 1: Write R code that would make vertical boxplots for M and S, from question 1, on the same plot with the following features: main title labeled as "Two Boxplots for Comparison_Put_Your_Name_here", names the M boxplot as "Boxplot for M", names the S boxplot as "Boxplot for S", colors the M Boxplot red and the S boxplot green. Step 2: Go to RRS and run your R code. Step 3: Submit your R code and boxplots from the R output(you can submit screenshots of your R code and boxplots or you can use a google doc).

Linear Algebra: A Modern Introduction
4th Edition
ISBN:9781285463247
Author:David Poole
Publisher:David Poole
Chapter2: Systems Of Linear Equations
Section2.2: Direct Methods For Solving Linear Systems
Problem 51EQ

Related questions
Question
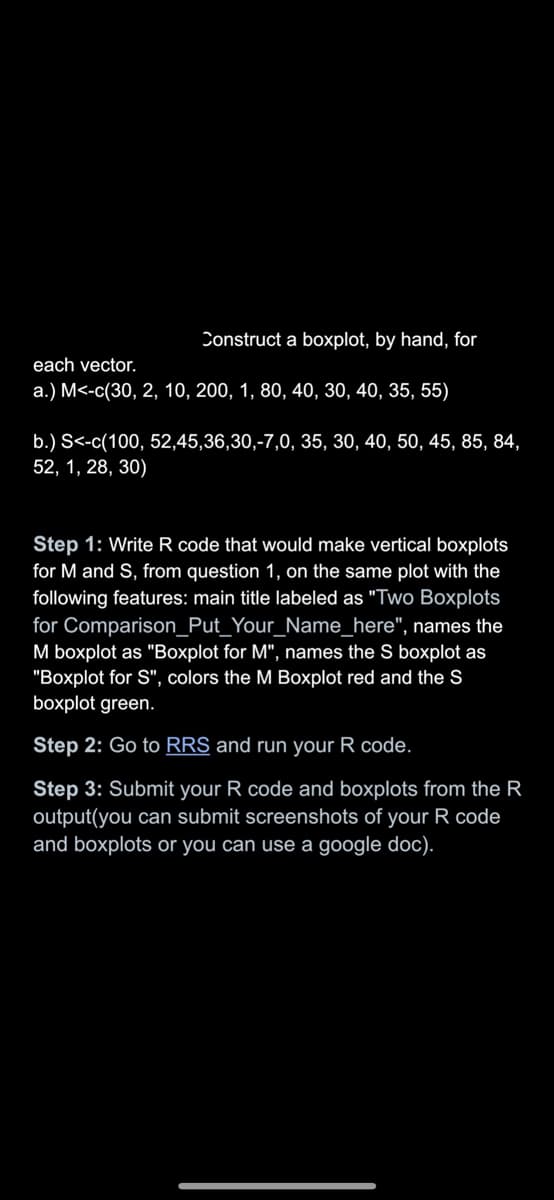
Transcribed Image Text:Construct a boxplot, by hand, for
each vector.
a.) M<-c(30, 2, 10, 200, 1, 80, 40, 30, 40, 35, 55)
b.) S<-c(100, 52,45,36,30,-7,0, 35, 30, 40, 50, 45, 85, 84,
52, 1, 28, 30)
Step 1: Write R code that would make vertical boxplots
for M and S, from question 1, on the same plot with the
following features: main title labeled as "Two Boxplots
for Comparison_Put_Your_Name_here", names the
M boxplot as "Boxplot for M", names the S boxplot as
"Boxplot for S", colors the M Boxplot red and the S
boxplot green.
Step 2: Go to RRS and run your R code.
Step 3: Submit your R code and boxplots from the R
output(you can submit screenshots of your R code
and boxplots or you can use a google doc).
Expert Solution
This question has been solved!
Explore an expertly crafted, step-by-step solution for a thorough understanding of key concepts.

Step by step
Solved in 2 steps with 2 images

Recommended textbooks for you
Linear Algebra: A Modern Introduction
Algebra
ISBN:
9781285463247
Author:
David Poole
Publisher:
Cengage Learning

Algebra & Trigonometry with Analytic Geometry
Algebra
ISBN:
9781133382119
Author:
Swokowski
Publisher:
Cengage

Elementary Linear Algebra (MindTap Course List)
Algebra
ISBN:
9781305658004
Author:
Ron Larson
Publisher:
Cengage Learning
Linear Algebra: A Modern Introduction
Algebra
ISBN:
9781285463247
Author:
David Poole
Publisher:
Cengage Learning
Algebra & Trigonometry with Analytic Geometry
Algebra
ISBN:
9781133382119
Author:
Swokowski
Publisher:
Cengage
Elementary Linear Algebra (MindTap Course List)
Algebra
ISBN:
9781305658004
Author:
Ron Larson
Publisher:
Cengage Learning

Trigonometry (MindTap Course List)
Trigonometry
ISBN:
9781337278461
Author:
Ron Larson
Publisher:
Cengage Learning

Trigonometry (MindTap Course List)
Trigonometry
ISBN:
9781305652224
Author:
Charles P. McKeague, Mark D. Turner
Publisher:
Cengage Learning