In the muon lifetime experiment, we obtain a histogram for the recorded decays as function of the time after the muon enters the detector. After binning the decays into discrete time bins, we expect the distribution of decays (histogram) to be described by an exponential function of time. Rather than fitting the data directly with an exponential function, it is sometimes more convenient to plot the logarithm of the decays in a bin (u.) as a function of time (r.) and
In the muon lifetime experiment, we obtain a histogram for the recorded decays as function of the time after the muon enters the detector. After binning the decays into discrete time bins, we expect the distribution of decays (histogram) to be described by an exponential function of time. Rather than fitting the data directly with an exponential function, it is sometimes more convenient to plot the logarithm of the decays in a bin (u.) as a function of time (r.) and

Algebra: Structure And Method, Book 1
(REV)00th Edition
ISBN:9780395977224
Author:Richard G. Brown, Mary P. Dolciani, Robert H. Sorgenfrey, William L. Cole
Publisher:Richard G. Brown, Mary P. Dolciani, Robert H. Sorgenfrey, William L. Cole
Chapter4: Polynomials
Section4.9: Area Problems
Problem 11P

Related questions
Question
please answer 2 and 3
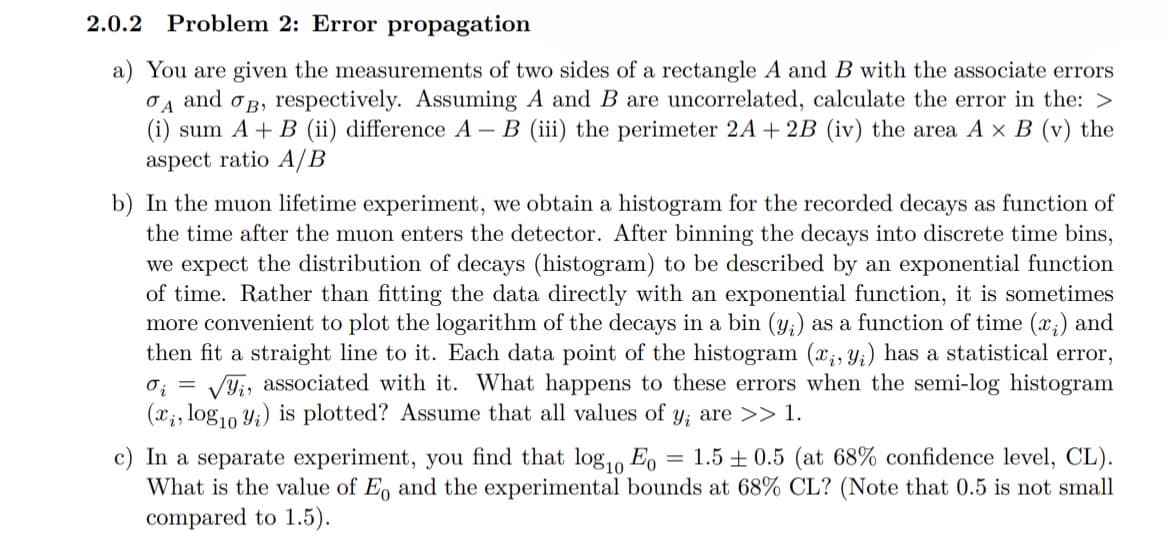
Transcribed Image Text:2.0.2 Problem 2: Error propagation
a) You are given the measurements of two sides of a rectangle A and B with the associate errors
A and B, respectively. Assuming A and B are uncorrelated, calculate the error in the: >
(i) sum A + B (ii) difference A - B (iii) the perimeter 2A + 2B (iv) the area A x B (v) the
aspect ratio A/B
b) In the muon lifetime experiment, we obtain a histogram for the recorded decays as function of
the time after the muon enters the detector. After binning the decays into discrete time bins,
we expect the distribution of decays (histogram) to be described by an exponential function
of time. Rather than fitting the data directly with an exponential function, it is sometimes
more convenient to plot the logarithm of the decays in a bin (y;) as a function of time (x₁) and
then fit a straight line to it. Each data point of the histogram (x, y) has a statistical error,
oi √, associated with it. What happens to these errors when the semi-log histogram
(x, log10 yi) is plotted? Assume that all values of y, are >> 1.
=
c) In a separate experiment, you find that log₁0 Eo = 1.5±0.5 (at 68% confidence level, CL).
What is the value of Eo and the experimental bounds at 68% CL? (Note that 0.5 is not small
compared to 1.5).
Expert Solution
This question has been solved!
Explore an expertly crafted, step-by-step solution for a thorough understanding of key concepts.

Step by step
Solved in 3 steps

Recommended textbooks for you
Algebra: Structure And Method, Book 1
Algebra
ISBN:
9780395977224
Author:
Richard G. Brown, Mary P. Dolciani, Robert H. Sorgenfrey, William L. Cole
Publisher:
McDougal Littell

Mathematics For Machine Technology
Advanced Math
ISBN:
9781337798310
Author:
Peterson, John.
Publisher:
Cengage Learning,

Algebra & Trigonometry with Analytic Geometry
Algebra
ISBN:
9781133382119
Author:
Swokowski
Publisher:
Cengage
Algebra: Structure And Method, Book 1
Algebra
ISBN:
9780395977224
Author:
Richard G. Brown, Mary P. Dolciani, Robert H. Sorgenfrey, William L. Cole
Publisher:
McDougal Littell
Mathematics For Machine Technology
Advanced Math
ISBN:
9781337798310
Author:
Peterson, John.
Publisher:
Cengage Learning,
Algebra & Trigonometry with Analytic Geometry
Algebra
ISBN:
9781133382119
Author:
Swokowski
Publisher:
Cengage