Construct a stem-and-leaf plot of the test scores 68, 73, 86, 75, 89, 89, 88, 90, 98, 100. How does the stem-and-leaf plot show the distribution of these data? ..... Construct the stem-and-leaf plot. Choose the correct answer below. O A. OB. Oc. OD. Stem Leaves Stem Leaves Stem Leaves Stem Leaves 6 8 8 8 7 36 7 35 7 35 7 35 6698 6998 8 6996 6899 9 0 9 9 07 9 08 08 10 10 0 10 10 How does the stem-and-leaf plot show the distribution of these data? O A. The lengths of the rows are similar to the heights of bars in a histogram; longer rows of data correspond to higher frequencies. O B. The lengths of the rows are similar to the widths of bars in a histogram; longer rows of data correspond to smaller frequencies. O C. The lengths of the rows are similar to the widths of bars in a histogram; longer rows of data correspond to higher frequencies. O D. The lengths of the rows are similar to the heights of bars in a histogram; longer rows of data correspond to smaller frequencies.
Construct a stem-and-leaf plot of the test scores 68, 73, 86, 75, 89, 89, 88, 90, 98, 100. How does the stem-and-leaf plot show the distribution of these data? ..... Construct the stem-and-leaf plot. Choose the correct answer below. O A. OB. Oc. OD. Stem Leaves Stem Leaves Stem Leaves Stem Leaves 6 8 8 8 7 36 7 35 7 35 7 35 6698 6998 8 6996 6899 9 0 9 9 07 9 08 08 10 10 0 10 10 How does the stem-and-leaf plot show the distribution of these data? O A. The lengths of the rows are similar to the heights of bars in a histogram; longer rows of data correspond to higher frequencies. O B. The lengths of the rows are similar to the widths of bars in a histogram; longer rows of data correspond to smaller frequencies. O C. The lengths of the rows are similar to the widths of bars in a histogram; longer rows of data correspond to higher frequencies. O D. The lengths of the rows are similar to the heights of bars in a histogram; longer rows of data correspond to smaller frequencies.

Glencoe Algebra 1, Student Edition, 9780079039897, 0079039898, 2018
18th Edition
ISBN:9780079039897
Author:Carter
Publisher:Carter
Chapter10: Statistics
Section10.3: Measures Of Spread
Problem 8PPS

Related questions
Question
100%
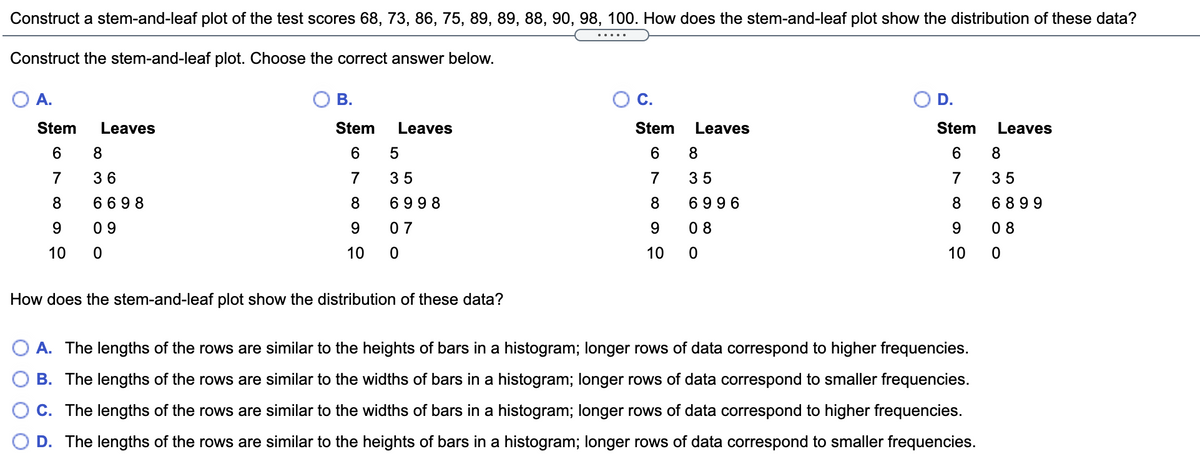
Transcribed Image Text:Construct a stem-and-leaf plot of the test scores 68, 73, 86, 75, 89, 89, 88, 90, 98, 100. How does the stem-and-leaf plot show the distribution of these data?
Construct the stem-and-leaf plot. Choose the correct answer below.
A.
В.
C.
D.
Stem
Leaves
Stem
Leaves
Stem
Leaves
Stem
Leaves
6
8.
6
8
7
36
7
35
7
35
7
35
8.
6 69 8
8.
6998
8
6996
8
6 899
0 9
9.
0 7
9.
0 8
9.
0 8
10
10
10
10
How does the stem-and-leaf plot show the distribution of these data?
A. The lengths of the rows are similar to the heights of bars in a histogram; longer rows of data correspond to higher frequencies.
B. The lengths of the rows are similar to the widths of bars in a histogram; longer rows of data correspond to smaller frequencies.
C. The lengths of the rows are similar to the widths of bars in a histogram; longer rows of data correspond to higher frequencies.
D. The lengths of the rows are similar to the heights of bars in a histogram; longer rows of data correspond to smaller frequencies.
Expert Solution
This question has been solved!
Explore an expertly crafted, step-by-step solution for a thorough understanding of key concepts.

This is a popular solution!

Trending now
This is a popular solution!

Step by step
Solved in 2 steps with 2 images

Recommended textbooks for you
Glencoe Algebra 1, Student Edition, 9780079039897…
Algebra
ISBN:
9780079039897
Author:
Carter
Publisher:
McGraw Hill

Holt Mcdougal Larson Pre-algebra: Student Edition…
Algebra
ISBN:
9780547587776
Author:
HOLT MCDOUGAL
Publisher:
HOLT MCDOUGAL

Big Ideas Math A Bridge To Success Algebra 1: Stu…
Algebra
ISBN:
9781680331141
Author:
HOUGHTON MIFFLIN HARCOURT
Publisher:
Houghton Mifflin Harcourt
Glencoe Algebra 1, Student Edition, 9780079039897…
Algebra
ISBN:
9780079039897
Author:
Carter
Publisher:
McGraw Hill
Holt Mcdougal Larson Pre-algebra: Student Edition…
Algebra
ISBN:
9780547587776
Author:
HOLT MCDOUGAL
Publisher:
HOLT MCDOUGAL
Big Ideas Math A Bridge To Success Algebra 1: Stu…
Algebra
ISBN:
9781680331141
Author:
HOUGHTON MIFFLIN HARCOURT
Publisher:
Houghton Mifflin Harcourt