Construct the Box-plot of the ages of the 100 employees.

Holt Mcdougal Larson Pre-algebra: Student Edition 2012
1st Edition
ISBN:9780547587776
Author:HOLT MCDOUGAL
Publisher:HOLT MCDOUGAL
Chapter11: Data Analysis And Probability
Section11.5: Interpreting Data
Problem 1C

Related questions
Question
100%
Construct the Box-plot of the ages of the 100 employees.
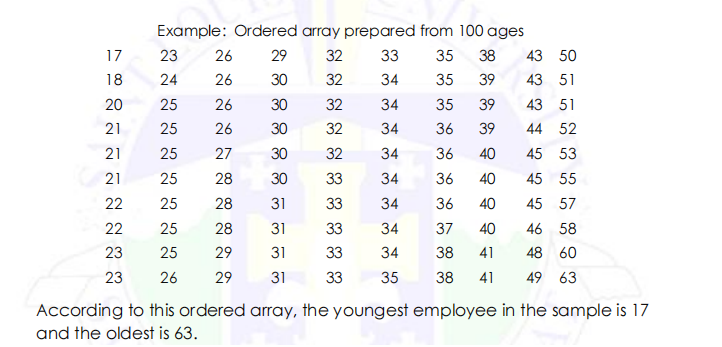
Transcribed Image Text:Example: Ordered array prepared from 100 ages
17
23
26
29
32
33
35
38
43 50
18
24
26
30
32
34
35
39
43 51
20
25
26
30
32
34
35
39
43 51
21
25
26
30
32
34
36
39
44 52
21
25
27
30
32
34
36
40
45 53
21
25
28
30
33
34
36
40
45 55
22
25
28
31
33
34
36
40
45 57
22
25
28
31
33
34
37
40
46 58
23
25
29
31
33
34
38
41
48 60
23
26
29
31
33
35
38
41
49 63
According to this ordered array, the youngest employee in the sample is 17
and the oldest is 63.
Expert Solution
This question has been solved!
Explore an expertly crafted, step-by-step solution for a thorough understanding of key concepts.

Step by step
Solved in 2 steps with 2 images

Recommended textbooks for you
Holt Mcdougal Larson Pre-algebra: Student Edition…
Algebra
ISBN:
9780547587776
Author:
HOLT MCDOUGAL
Publisher:
HOLT MCDOUGAL
Holt Mcdougal Larson Pre-algebra: Student Edition…
Algebra
ISBN:
9780547587776
Author:
HOLT MCDOUGAL
Publisher:
HOLT MCDOUGAL