Create a scatter plot of the data

Glencoe Algebra 1, Student Edition, 9780079039897, 0079039898, 2018
18th Edition
ISBN:9780079039897
Author:Carter
Publisher:Carter
Chapter10: Statistics
Section10.3: Measures Of Spread
Problem 1GP

Related questions
Question
Create a
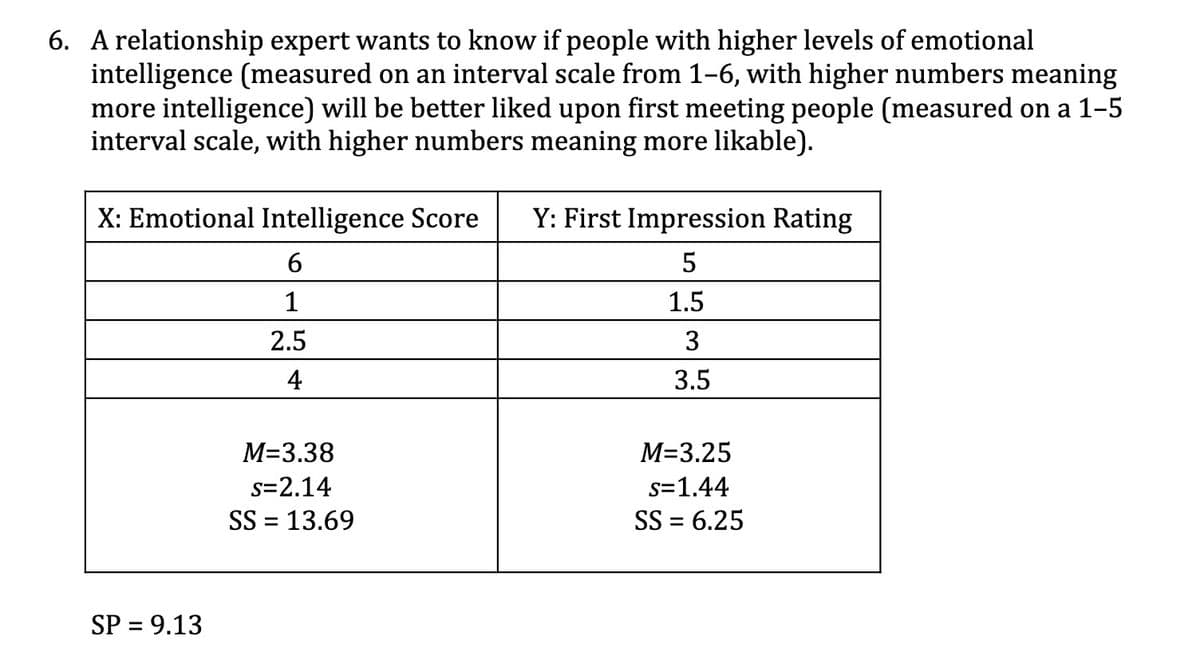
Transcribed Image Text:6. A relationship expert wants to know if people with higher levels of emotional
intelligence (measured on an interval scale from 1-6, with higher numbers meaning
more intelligence) will be better liked upon first meeting people (measured on a 1-5
interval scale, with higher numbers meaning more likable).
X: Emotional Intelligence Score
Y: First Impression Rating
1
1.5
2.5
3
4
3.5
M=3.38
M=3.25
s=2.14
s=1.44
SS = 13.69
SS = 6.25
%D
SP = 9.13
Expert Solution
This question has been solved!
Explore an expertly crafted, step-by-step solution for a thorough understanding of key concepts.

Step by step
Solved in 2 steps with 2 images

Recommended textbooks for you
Glencoe Algebra 1, Student Edition, 9780079039897…
Algebra
ISBN:
9780079039897
Author:
Carter
Publisher:
McGraw Hill
Glencoe Algebra 1, Student Edition, 9780079039897…
Algebra
ISBN:
9780079039897
Author:
Carter
Publisher:
McGraw Hill