(Continues Exercise 7 in Section 8.1.) To try to improve the prediction of FEV, additional independent variables are included in the model. These new variables are Weight (in kg), the product (interaction) of Height and Weight, and the ambient temperature (in °C). The following MINITAB output presents results of fitting the mode FEV, = b, + P Last FEV, + ß; Gender + , Height + B, Weight + ß; Height - Weight + P. Temperature + ß, Pressure + E The regression equation is FEV1 = -0.257 + 0.778 Last FEV – 0.105 Gender + 1.213 Height - 0.00624 Weight + %3D 0.00386 Height*Weight – 0.00740 Temp - 0.00148 Pressure Predictor Coef SE Coef тР Constant -0.2565 0.7602 -0.340.736 Last FEV 0.77818 0.05270 14.770.000 Gender -0.10479 0.03647-2.870.005 Height Weight Height*Weight 0.0038642 0.008414 0.460.647 Temp 1.2128 0.4270 2.840.005 -0.0062446 0.01351-0.460.645 -0.007404 0.009313 -0.790.428 Pressure -0.00147730.0005170 -2.860.005 S = 0.22189 R-Sq = 93.5% R-Sq(adj) = 93.2% Analysis of Variance Source DF MS Regression 7111.35 15.907323.060.000 Residual 1577.73020.049237 Error Total 164119.08 The following MINITAB output, reproduced from Exercise 7 in Section 8.1, is for a reduced model in which Weight, Height · Weight, and Temp have been dropped. Compute the F statistic for testing the plausibility of the reduced model. a. The regression equation is FEV1 = -0.219 + 0.779 Last FEV – 0.108 Gender + 1.354 Height – 0.00134 Pressure Predictor Coef SE Coef тР Constant -0.21947 0.4503-0.490.627 0.779 0.04909 15.870.000 Last FEV Gender Height Pressure -0.00134310.0004722-2.840.005 -0.10827 0.0352 -3.080.002 1.3536 0.2880 4.700.000 R-Sq = 93.5% R-Sq(adj) = 93.3% 0.22039 Analysis of Variance Source DF MS Regression 4111.31 27.826572.890.000 Residual 1607.77160.048572 Error Total 164119.08 How many degrees of freedom does the F statistic have? Find the P-value for the F statistic. Is the reduced model plausible? d. Someone claims that since each of the variables being dropped had large P-values, the reduced model must be plausible, and it was not necessary to perform an F test. Is this correct? Explain why or why not. b. C. The total sum of squares is the same in both models, even though the independent variables are different. Is there a mistake? Explain. e.
(Continues Exercise 7 in Section 8.1.) To try to improve the prediction of FEV, additional independent variables are included in the model. These new variables are Weight (in kg), the product (interaction) of Height and Weight, and the ambient temperature (in °C). The following MINITAB output presents results of fitting the mode FEV, = b, + P Last FEV, + ß; Gender + , Height + B, Weight + ß; Height - Weight + P. Temperature + ß, Pressure + E The regression equation is FEV1 = -0.257 + 0.778 Last FEV – 0.105 Gender + 1.213 Height - 0.00624 Weight + %3D 0.00386 Height*Weight – 0.00740 Temp - 0.00148 Pressure Predictor Coef SE Coef тР Constant -0.2565 0.7602 -0.340.736 Last FEV 0.77818 0.05270 14.770.000 Gender -0.10479 0.03647-2.870.005 Height Weight Height*Weight 0.0038642 0.008414 0.460.647 Temp 1.2128 0.4270 2.840.005 -0.0062446 0.01351-0.460.645 -0.007404 0.009313 -0.790.428 Pressure -0.00147730.0005170 -2.860.005 S = 0.22189 R-Sq = 93.5% R-Sq(adj) = 93.2% Analysis of Variance Source DF MS Regression 7111.35 15.907323.060.000 Residual 1577.73020.049237 Error Total 164119.08 The following MINITAB output, reproduced from Exercise 7 in Section 8.1, is for a reduced model in which Weight, Height · Weight, and Temp have been dropped. Compute the F statistic for testing the plausibility of the reduced model. a. The regression equation is FEV1 = -0.219 + 0.779 Last FEV – 0.108 Gender + 1.354 Height – 0.00134 Pressure Predictor Coef SE Coef тР Constant -0.21947 0.4503-0.490.627 0.779 0.04909 15.870.000 Last FEV Gender Height Pressure -0.00134310.0004722-2.840.005 -0.10827 0.0352 -3.080.002 1.3536 0.2880 4.700.000 R-Sq = 93.5% R-Sq(adj) = 93.3% 0.22039 Analysis of Variance Source DF MS Regression 4111.31 27.826572.890.000 Residual 1607.77160.048572 Error Total 164119.08 How many degrees of freedom does the F statistic have? Find the P-value for the F statistic. Is the reduced model plausible? d. Someone claims that since each of the variables being dropped had large P-values, the reduced model must be plausible, and it was not necessary to perform an F test. Is this correct? Explain why or why not. b. C. The total sum of squares is the same in both models, even though the independent variables are different. Is there a mistake? Explain. e.

Big Ideas Math A Bridge To Success Algebra 1: Student Edition 2015
1st Edition
ISBN:9781680331141
Author:HOUGHTON MIFFLIN HARCOURT
Publisher:HOUGHTON MIFFLIN HARCOURT
Chapter1: Solving Linear Equations
Section1.5: Rewriting Equations And Formula
Problem 49E

Related questions
Question
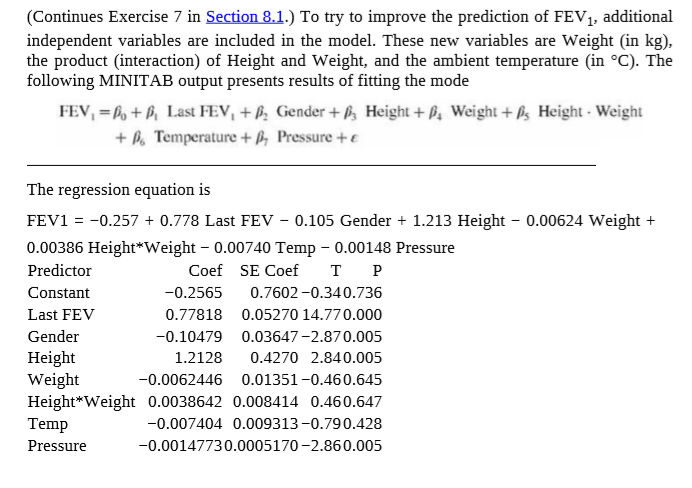
Transcribed Image Text:(Continues Exercise 7 in Section 8.1.) To try to improve the prediction of FEV, additional
independent variables are included in the model. These new variables are Weight (in kg),
the product (interaction) of Height and Weight, and the ambient temperature (in °C). The
following MINITAB output presents results of fitting the mode
FEV, = b, + P Last FEV, + ß; Gender + , Height + B, Weight + ß; Height - Weight
+ P. Temperature + ß, Pressure + E
The regression equation is
FEV1 = -0.257 + 0.778 Last FEV – 0.105 Gender + 1.213 Height - 0.00624 Weight +
%3D
0.00386 Height*Weight – 0.00740 Temp - 0.00148 Pressure
Predictor
Coef SE Coef
тР
Constant
-0.2565
0.7602 -0.340.736
Last FEV
0.77818 0.05270 14.770.000
Gender
-0.10479
0.03647-2.870.005
Height
Weight
Height*Weight 0.0038642 0.008414 0.460.647
Temp
1.2128
0.4270 2.840.005
-0.0062446 0.01351-0.460.645
-0.007404 0.009313 -0.790.428
Pressure
-0.00147730.0005170 -2.860.005
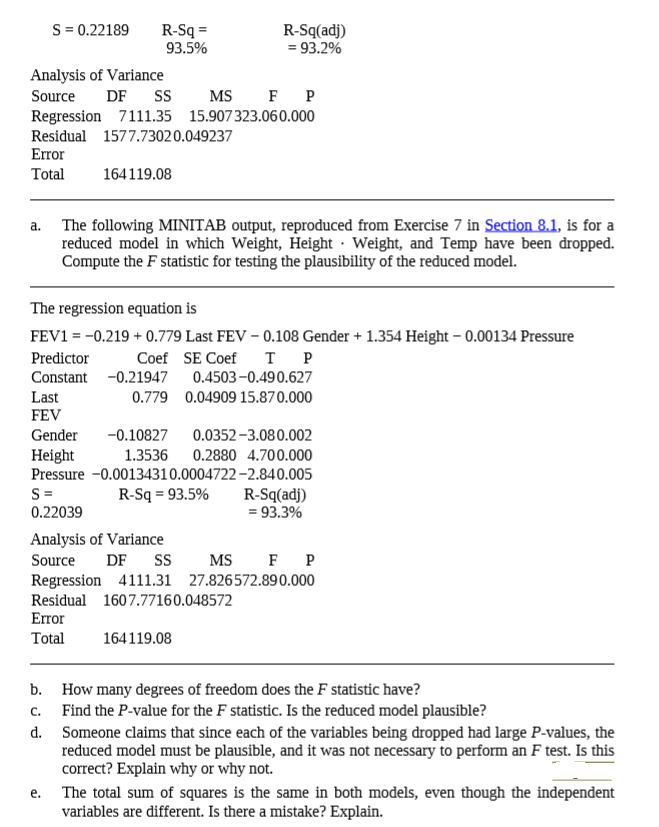
Transcribed Image Text:S = 0.22189
R-Sq =
93.5%
R-Sq(adj)
= 93.2%
Analysis of Variance
Source
DF
MS
Regression 7111.35 15.907323.060.000
Residual 1577.73020.049237
Error
Total
164119.08
The following MINITAB output, reproduced from Exercise 7 in Section 8.1, is for a
reduced model in which Weight, Height · Weight, and Temp have been dropped.
Compute the F statistic for testing the plausibility of the reduced model.
a.
The regression equation is
FEV1 = -0.219 + 0.779 Last FEV – 0.108 Gender + 1.354 Height – 0.00134 Pressure
Predictor
Coef SE Coef
тР
Constant -0.21947 0.4503-0.490.627
0.779 0.04909 15.870.000
Last
FEV
Gender
Height
Pressure -0.00134310.0004722-2.840.005
-0.10827
0.0352 -3.080.002
1.3536
0.2880 4.700.000
R-Sq = 93.5%
R-Sq(adj)
= 93.3%
0.22039
Analysis of Variance
Source
DF
MS
Regression 4111.31 27.826572.890.000
Residual 1607.77160.048572
Error
Total
164119.08
How many degrees of freedom does the F statistic have?
Find the P-value for the F statistic. Is the reduced model plausible?
d. Someone claims that since each of the variables being dropped had large P-values, the
reduced model must be plausible, and it was not necessary to perform an F test. Is this
correct? Explain why or why not.
b.
C.
The total sum of squares is the same in both models, even though the independent
variables are different. Is there a mistake? Explain.
e.
Expert Solution
This question has been solved!
Explore an expertly crafted, step-by-step solution for a thorough understanding of key concepts.

This is a popular solution!

Trending now
This is a popular solution!

Step by step
Solved in 2 steps

Recommended textbooks for you
Big Ideas Math A Bridge To Success Algebra 1: Stu…
Algebra
ISBN:
9781680331141
Author:
HOUGHTON MIFFLIN HARCOURT
Publisher:
Houghton Mifflin Harcourt
Big Ideas Math A Bridge To Success Algebra 1: Stu…
Algebra
ISBN:
9781680331141
Author:
HOUGHTON MIFFLIN HARCOURT
Publisher:
Houghton Mifflin Harcourt