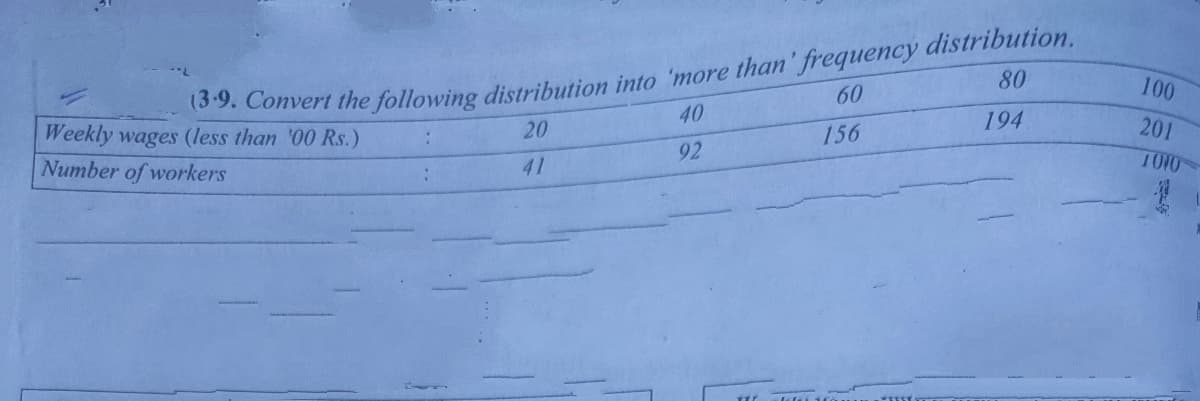
Convert the following distribution into 'more than' frequency distribution. 40 80 100 60 Weekly wages (less than '00 Rs.) 20 194 201 156 41 92 1010 Number of workers


Q: Examine the frequency distribution. Commission Frequency last month $500-$749 8 $750-$999 12…
A:
Q: The following table shows the frequency distribution for the number of children under 10 years old…
A:
Q: 3. Find A.M. from the following frequency distribution. Wages 100 120 140 160 No. of workers 4 8 12…
A:
Q: A Quick-Change Oil company has a number of outlets. The numbers of oil changes at the 2nd street…
A: Note: According to Bartleby guidelines, expert solve only one question and maximum 3 subpart of the…
Q: Find the missing frequency from the following data Marks Frequency 0-5 10 5-10 12 10-15 16 15-20 -…
A: From the provided information, The average mark is 16.82. Marks Frequency 0-5 10…
Q: Find the missing frequency in the following distribution if N is 100 and median is 30. Marks No. of…
A:
Q: The arithmetic mean for the following distribution Class Intervals 5-10 10-15 Frequency 1. 15- 20…
A:
Q: Calculate the median for the following frequency distribution: Marks No. of Students Marks No. of…
A: Given data is Marks No. of students 05-10 7 10-15 12 15-20 24 20-25 31 25-30 42 30-35…
Q: 5. For the following grouped frequency distribution table of exam scores, what is the lowest score…
A: The first class starts from 50-59 so the minimum score must be in the class may or may not be 50. So…
Q: The arithmetic mean for the following distribution Frequency Class Intervals 5-10 10 10-15 15-20…
A:
Q: The salaries (in millions of dollars) for 22 National Football League (NFL) teams for a specific…
A: We have given the frequency distribution as:
Q: Prepare a frequency table with class interval of 10 kg. and first class as 40-50. Also find out the…
A:
Q: 8. The following frequency distribution table is for 50 students who took a competency test. The…
A: Frequency Histogram:
Q: Find the AM for the following distribution: Class 350 -369 370 -389 390 -409 410 - 429 430 -449 450…
A: Given distribution is, Class interval 350-369 370-389 390-409 410-429 430-449 450-469 470-489…
Q: Calculate the mean of the given frequency distribution 10-20 20-30 30-40 40-50 Class intervals:…
A: We have given that the frequency distribution table. The total frequency is 75.
Q: Determine the standard deviation for the following frequency distribution: Limits Frequency…
A:
Q: The following table gives the frequency distribution of prices for a sample of 30 college textbooks.…
A: From the given data: Price Midpoint (x) f xf 20-30 25 4 100 30-40 35 7 245 40-50 45 13 585…
Q: The Quick Change Oil Company has a number of outlets. The numbers of oil changes at the Oak Street…
A: (b) Determine the class interval that can be suggested. The class interval is suggested below…
Q: For the following grouped frequency distribution table of exam scores,how many students had scores…
A: Given : Frequency table : X_________f 60-64 3 55-59 4 50-54 5 45-49…
Q: The following table summarizes the ages of 189 people qualifying for disability insurance. Use the…
A: age class frequency f xi fx 24-29 22 26.5 583 30-35 13 32.5 422.5 36-41 26 38.5 1001 42-47…
Q: The arithmetic mean for the following distribution Frequency Class Intervals 5 – 10 10 10 – 15 1 15…
A: Given
Q: 1. From the data 1, 4, 5, 3, 2, 5, 7, 3, 4, 5, Sophie created the following frequency distribution…
A: Data: 1,4,5,3,2,5,7,3,4,5 The given frequency table is : Scores f cf 1 1 0 2 1 1 3 2 2 4…
Q: Calculate the mean of the grouped data from the given frequency distribution. Round your answer to…
A:
Q: Find the mode of the following distribution: Class - interval: 0-10 10-20 20-30 30-40 40-50 50-60…
A:
Q: For the following frequency distribution of exam scores, what is the lowest score on the exam? f…
A: The lowest class is 70-74
Q: 1. For the following set of data. 13, 16, 15, 22, 26, 32, 37, 37, 40, 44, 47, 53, 55, 59, 62, 67,…
A:
Q: The amounts (in dollars) paid by 20 students for textbooks during the fall term are given on the…
A: Frequency is the number of observations that occur within the range of interval. If the frequencies…
Q: Below is the frequency distribution table of the Mathematics test scores of 50 students. What…
A: Scores Frequency 46 -50 4 41-45 8 36-40 11 31-35 9 26-30 12 21-25 6
Q: Your grandma wants to review the distribution of the ages of her Facebook friends. The ages of a…
A: We have to construct a frequency, relative frequency and cumulative relative frequency distribution…
Q: For the following frequency distribution table calculate the mean, where the class limit is 4 Class…
A: Mean is one of the measure of central tendency. It measure the average of observation in the data…
Q: For the following frequency distribution, what is EX? f 60-64 55-59 11 50-54 8 45-49 40-44 6 O 39 O…
A:
Q: Marks obtained by 30 students in History of a Test Examination 2021 of some school are as follows:…
A: Given Data :
Q: For the given frequency distribution, calculate 90th percentile Po.90 Class Limit 1-7 8-14 Frequency…
A: We first find the cumulative distribution: Classes Frequency Cumulative 1-7 8 8 2-14 12 20…
Q: Calculate the mean of the grouped data from the given frequency distribution. Round your answer to…
A: Solution: Class Frequency(f) Midpoint (x) fx 40-49 2 44.5 89 50-59 5 54.5 272.5 60-69…
Q: 1. The following data represents the heart beat rate, in bpm, of patients in a hospital. (a) Create…
A: Frequency : The number of times a data occurs in a data set is known as the frequency of data.…
Q: For the following frequency distribution : Sales in Rs (1000) Frequency 16-30 39 31-45 25 46-60…
A: Hi! Thank you for the question As per the honour code, We’ll answer the first question since the…
Q: Calculate the median for the following frequency distribution: Marks No. of Students Marks No. of…
A:
Q: The table below shows the monthly incomes (in thousands) of Mr. Adam. 11 56 | 43 21 11 12 11 10 | 48…
A: Since you have posted a question with multiple subparts, we will solve first three subparts for you.…
Q: For the following frequency distribution table calculate the mean, where the class limit is 4 Class…
A:
Q: Q2- Calculate Mean and Q1 & Q3 from the following frequency distribution: Wages in Rs. 150-170…
A:
Q: The following Frequency Distribution for Blood Glucose levels collected over 1 month (in mg/dL).…
A: Class Limit Frequency (f) Class Width Cumulative Frequency Relative Frequency (f/Σf) 60-79 3…
Q: Using 6 classes of width 50 starting at 100, construct a frequency distribution for the following…
A: Frequency Distribution: A frequency distribution is representations of data in a graphical or…
Q: Consider the following frequency distribution. Class Frequency 2 up to 4 24 4 up to 6 56 6…
A:
Q: The following data represent the weights (kg) of a sample of the 37 students in one of the colleges.…
A: Solution-: We create frequency distribution table
Q: The following frequency distribution table is for 50 students who took a competency test. The data…
A: Given data is Test scores Frequency 300-399 2 400-499 13 500-599 19 600-699 11 700-799…
Q: 2. Construct FREQUENCY DISTRIBUTION TABLE. Show your solution for each step in constructing FDT. 135…
A: The minimum and maximum value of the data is 40 and 140 respectively. it seems appropriate to make…
Q: 6. Below is a frequency distribution. Classes 0-14 4. 15-29 18 30-44 12
A: (a) - Mean deviation : Mean ˉx∑fx/∑f =1649/47 =35.0851 Class(1) f(2) Mid value…
Q: 5. Find the median for the following distribution. Income above Rs 1000 1500 2000 2500 3000 3500…
A:
Q: Use the above data as provided below to create a grouped frequency distribution. Show work leading…
A: The given data is, 38 8 42 6 12 42 9 44 12 14 45 53 16 48 18 19 54 23 21 59 24 26 32 35 37 As we…
Q: What is the Class Width for this frequency distribution? (fill in the blank below) Class Width =…
A: Given Data : Class Limits Frequency 0.1 - 1.5 10 1.6 - 3.0 14 3.1 -…

Step by step
Solved in 2 steps
