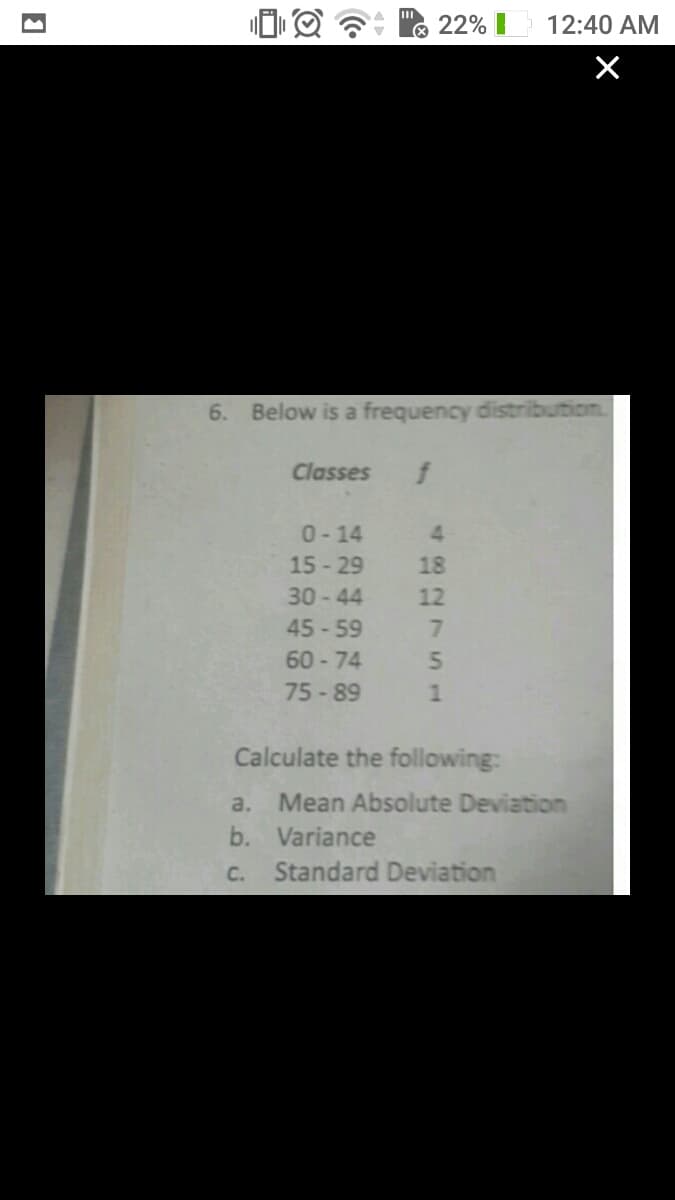
6. Below is a frequency distribution. Classes 0-14 4. 15-29 18 30-44 12


Q: 2. Construct a frequency distribu lowing set of scores. Include and percentage in your tables 5 7 8…
A: Here construct frequency distribution Table from given dataset of scores Xi = score fi = frequency…
Q: Examine the frequency distribution. Plant Height (inches) Frequency 8–11 2 12–15 6 16–19 11 20–23…
A: The width of a class in a frequency distribution is the difference between the upper and lower class…
Q: Calculate the median for the following frequency distribution: Marks No. of Students Marks No. of…
A: Given data is Marks No. of students 05-10 7 10-15 12 15-20 24 20-25 31 25-30 42 30-35…
Q: You are given the following frequency distribution, Class Frequency 10 – 19 12 20 – 29 19 - 30 – 39…
A: The given frequency distribution is, Class Frequency 10-19 12 20-29 19 30-39 24 40-49 35
Q: Find the Mean For the following frequency distribution Limits Frequency 3- 13 2 14 - 24 4 25 35 7 36…
A: For a grouped dataset, the frequency of a class gives the number of observations that lies in that…
Q: A frequency distribution for the age of Canada's population in July of 2012 is shown in the table.…
A: A data can be raw or grouped, with some pro and cons associated with both of them. The raw data has…
Q: 2. Here are the score of 40 high school students in a statistics 54 44 81 65 91 95 88 47 19 26 78 64…
A: "Since you have posted a question with multiple subparts, we will solve first 3 sub-parts for you.…
Q: 1. Construct the frequency distribution corresponding to the ogive curve given below. 100 90 80 70…
A: We want to construct Frequency distribution corresponding to the ogive curve
Q: 26. From the following frequency distribution, you find Median. Classes Belo Belo Belo Belo Belo…
A: Given: Class Frequency 0 - 100 6 100 - 200 10 200 - 250 18 250 - 350 24 350 - 400 14…
Q: If the first class in the frequency distribution starts at 19 and the class width is 4, then the…
A:
Q: d) Construct a frequency distribution from the frequency polygon. Number of Messages Number of…
A: Number of messages Number of people 3 2 4 5 5 8 6 3 7 2 8 10 9 8 10 4 11 0…
Q: The Quick Change Oil Company has a number of outlets in the metropolitan Seattle area. The daily…
A: Hi there! Thank you for posting the question. As your question has more than 3 parts, we have solved…
Q: III. The data represent the ages of Presidents at the time they were first inaugurated. 57 61 57 57…
A: A histogram is used to understand the distribution of the data. In a histogram, the x-axis values…
Q: 8. The ages of people going to Boracay from Dec. 21 - 23 were listed. Construct a frequency…
A: Given : 41 54 47 17 55 62 35 32 31 48 44 52 39 21 53 75 35 14 28 25 44 63 60 21 22 42 26 36…
Q: The range of a given dataset is 12.5, if 7 classes are used to construct a frequency distribution,…
A: Width of each class is approximately 1.79
Q: if necessary. 1) The following table displays the age, in years, and sex for the residents of a…
A:
Q: 2. Following are the marks (X) obtained by 25 students (f) in an examination. Prepare a grouped…
A: The lowest number is 11 and the highest number is 69. So, we can create a frequency distribution…
Q: Given class interval 40-44 of a frequency distribution table, what is the class width? A 42 B 5 D)…
A:
Q: Pupils Per Teacher The average number of pupils per teacher in certain states is shown. 9 13 16 18…
A: Solution-: Given: Number of classes =k=7 What is class width for a frequency distribution with 7…
Q: Consider the following frequency table representing the distribution of the length of a morning walk…
A: Formula to find midpoint of class is , Midpoint = Lower limit of class + upper limit of class 2
Q: 12. FILE The Quick Change Oil Company has a number of outlets in the metropolitan Seat- tle area.…
A: Since you have posted a question with multiple sub parts, according to our guidelines we can solve…
Q: Approximate the mean of the frequency distribution for the ages of the residents of a town. Age…
A:
Q: Example 3 Calculate the mean of the given frequency distribution. Class intervals: 10-20 20-30 30-40…
A:
Q: It seems these days that students have to work more and more each week to be able to afford the…
A: Mean is the average of a set of scores. It is found by adding up all scores and dividing the sum by…
Q: Consider the following frequency distribution. Class Midpoint Frequency 0 - 9 4.5 2 10 – 19 14.5 8.…
A:
Q: The following data are obtained in the survey on the number of cell phones possessed by each family.…
A: Solve first three sub-parts in a multiple sub-part question, unless the student has asked for…
Q: data in the following frequency distribution table Classes 50 - 70 - 90 - 110 - | 130 - 150 - 170 fi…
A: Hello! As you have posted more than 3 sub parts, we are answering the first 3 sub-parts. In case…
Q: 3. Listed below are the speeds from 30 random speeding tickets in Denver over the last week. Create…
A: Provided information is; number of observations(N) = 30 Given data is ; 48 92 50 29 40 129 43 108…
Q: The following are the introductory math scores for busniness economucs from 40 FEB students…
A: Given : data To construct frequency distribution ii) how many students scored above 68. the data in…
Q: Pupils Per Teacher The average number of pupils per teacher in certain states is shown. 24 14 18 23…
A: The average number of pupils per teacher in a certain states is shown as follows. 24 14 18 23 27…
Q: Approximate the mean of the frequency distribution for the ages of the residents of a town. Age…
A:
Q: The following table represents a grouped frequency distribution of the number of hours spent…
A: The following table represents a grouped frequency distribution of the number of hours spent…
Q: | 21 22 / 2 Illustration 6.8. Prepare a bivariate frequency distribution for the following data:…
A:
Q: Determine the median for the following frequency distribution table: Class Interval Frequency 0 – 3…
A: Median: Median is a Statistics Measure of Central Tendency that gives the middle most value of a set…
Q: Calculate the median for the following frequency distribution: Marks No. of Students Marks No. of…
A:
Q: 3. Consider the result of a fictional Statistics final exam taken by 120 students, as given in the…
A:
Q: The table below shows the monthly incomes (in thousands) of Mr. Adam. 11 56 | 43 21 11 12 11 10 | 48…
A: Since you have posted a question with multiple subparts, we will solve first three subparts for you.…
Q: 2. A group of adults where asked how many cars they had in their household a. Complete the frequency…
A: Consider the given equation: Here, the given data of cars they had in their household,
Q: 55 30 50 15 2 Speed of Highway Drivers 60 50 40 30 20 10 50 55 60 65 70 75 80 85 Speed (in mph) a.…
A: The graph of number of drivers against speed is given.
Q: Q2- The following table includes the grades of students who took Math during Fall. 40 55 50 55 28 60…
A: The data is 40,55,50,55,28,60,25,55,60,65,70,64,62,70,50,65,55,48,69,25,64,58,55,71
Q: 2. The number of class intervals in a frequency distribution (or bar chart) will be approximately…
A: Range = Maximum -Minimum
Q: 3. The following data values are listed below. Construct a grouped frequency distribution with 5…
A: To create Frequency table, we generate class Intervals according to the given data set then count…
Q: Find the mean, median, and mode for the following frequency distribution. f 4 6. 6. 2 7 1 8. 8. 10 4…
A: We need to find mean, median and mode for the following data x f 4 4 5 9 6 2 7 1 8 8…
Q: (a) If 75% of the items were sold in birr 45 or less and most items were sold in birr 34, find the…
A:
Q: For numbers 9 toll, use the grouped frequency distribution below. Class Interval Frequency 50-54 4…
A:
Q: Consider the following frequency distribution. Class Frequency 2 up to 4 24 4 up to 6 56 6…
A:
Q: Given the data below are the number of students in each age group. Number of students 3 2 6 6 5 6…
A:
Q: 8. Find the Men, Mode and Median for A) the given frequency distribution table 6. 10 4. 3. 1
A:
Q: Given class interval 40-44 of a frequency distribution table, what is the class width? A 24 B) 4 42…
A:
Q: C.W: The following frequency table represent the number of iPods sold within 30 days. IPods sold No.…
A: As per our guidelines we are allowed to answer only three subparts of a question. Kindly repost the…
Q: 13 16 18 21 25 26 12 11 23 8 21 14 12 13 17 11 11 12 13 16 16 11 12 15 18 14 11 12 17 15 14 14 16 20…
A: Since you have posted a question with multiple sub-parts, we will solve first 3 sub-parts for you.…
Q: 4. Draw a 'less than ogive' for the following frequency distribution Marks No. of Students 0-4 4-8…
A:
Q: 3.1) We have the following Political Blog Reading Times (in minutes): 7 39 13 9 25 8 22 0 2 18 2…
A: We have given data 7 39 13 9 25 8 22 0 2 18 2 30 735 12 15 8 6 5 29 0 11 39 16 15
Q: III. The data represent the ages of Presidents at the time they were first inaugurated. 57 61 57 57…
A: g) According to the provided information, the age of the youngest President is 46. 46 is the…
Q: Build the frequency distribution table with 5 classes, and for the following observations for some…
A: Since you have asked multiple questions, we will solve the first question for you. If you want any…
Q: Use the above data as provided below to create a grouped frequency distribution. Show work leading…
A: The given data is, 38 8 42 6 12 42 9 44 12 14 45 53 16 48 18 19 54 23 21 59 24 26 32 35 37 As we…
Q: Complete the frequency distribution table for the data given in the graph: O 5 20 25 0 Class limits…
A: We can find the answer from frequency distribution

Step by step
Solved in 2 steps


